How to calculate safety stock to save money
Why should I calculate and use safety stock?
Determining the right stock levels for a business can be very challenging. Carrying too much inventory ties up working capital and slows down cash flow. Carrying too little leads to stockouts and poor service levels. An important step in finding the balance is accurately calculating safety stock levels.
What is safety stock?
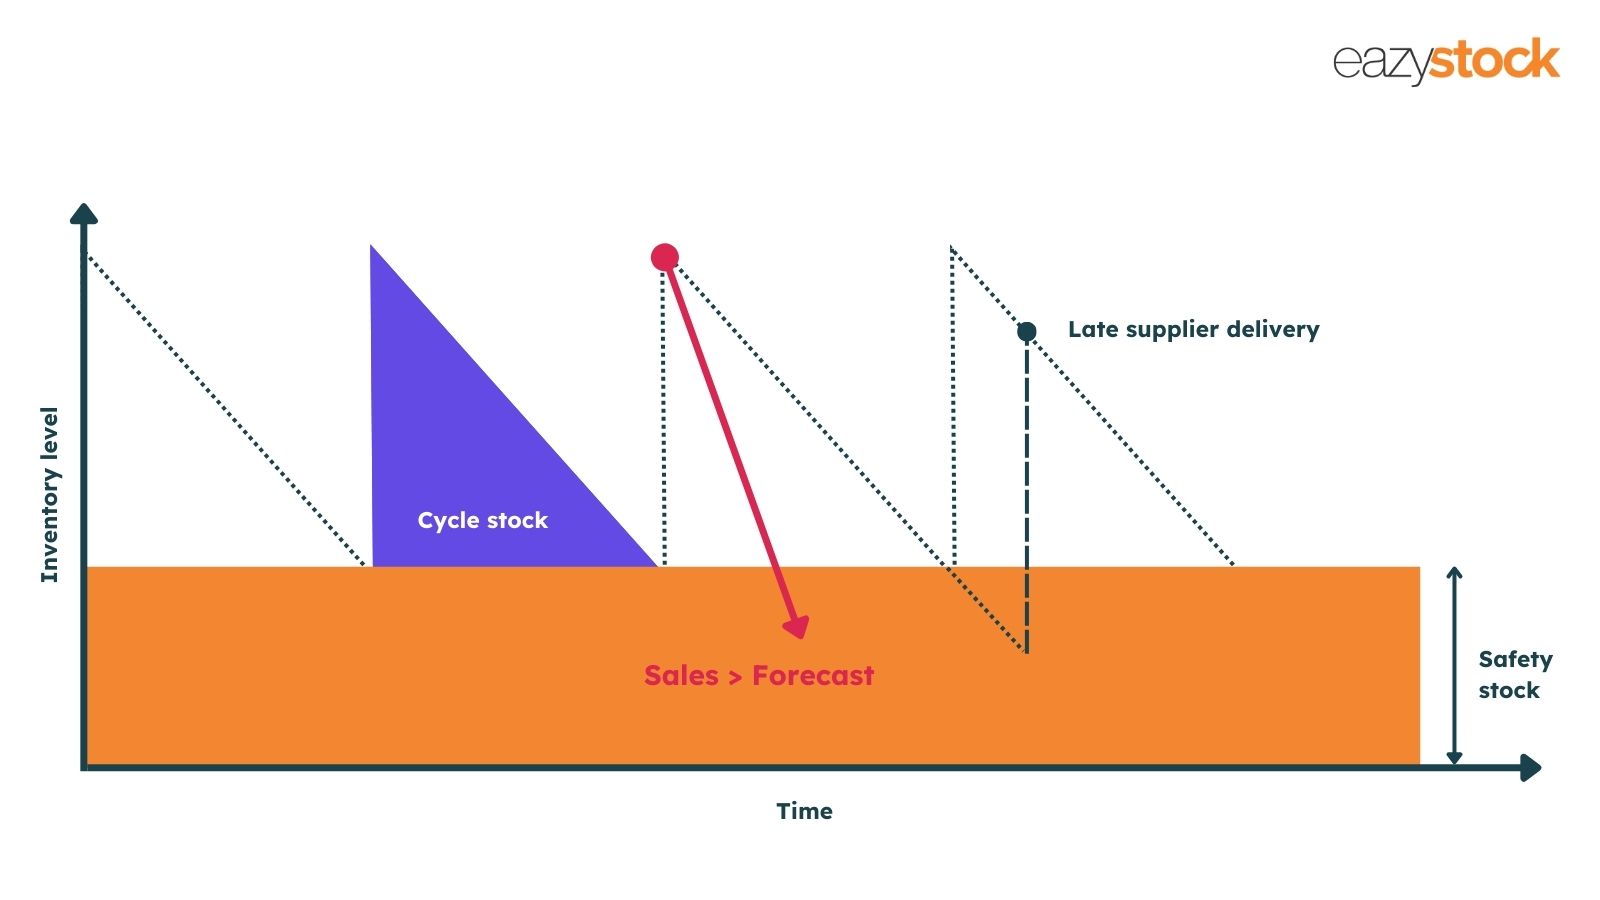
Safety stock is inventory carried to prevent stockouts caused by fluctuating customer demand, forecast inaccuracies or supplier lead time variability. It is intended to cover any shortfall in cycle stock during the lead time and is a key element of the reorder point formula:

The purpose of safety stock is to reduce disruption to order fulfilment, while minimising capital invested in inventory.
When demand for inventory items is consistent and lead times are reliable, it’s fairly easy to determine the amount of safety stock to meet these conditions. However, when demand and supply fluctuate, many inventory planners struggle to calculate safety stock accurately. Too often, they rely on simple formulas that fail to address their specific supply-and-demand challenges.
Calculate your safety stock today with our:
Three simple formulas to calculate safety stock
Calculating safety stock can be simple or complex, depending on your approach. Here are three straightforward safety stock formulas along with their advantages and disadvantages.
1. Fixed safety stock levels
Many companies set a fixed safety stock level for their inventory items, i.e. they add a ‘best-guess’ quantity to the reorder point to allow for any issues.
This number is often set at item group level based on the inventory manager’s – there are no formal calculations used.
Let’s use Mary’s Plumbing Warehouse as an example. Mary has analysed her sales from the previous month and used these figures to set her forecast for the next four weeks:

She could now simply choose to hold one week’s worth of safety stock for each item, based on last month’s peak weekly sales, which is 650, 300 and 700 respectively.
This simple method is easy to set up and manage, but often results in stock imbalances. For example, Mary might end up with too much capital invested in excess stock of Showerhead C, while she could easily run out of Showerhead B.
2. Time-based safety stock formula
A time-based calculation determines the average sales over a fixed period and uses this value as the safety stock level.
For example, if Mary uses her average weekly forecasts (based on last month’s sales) to calculate safety stock, she would end up with 525 units of Showerhead A, 250 extra units of Showerhead B and 475 units of Showerhead C.

However, as with using the fixed method, time-based calculations can also often lead to overstocking and understocking.
One reason for this is that both approaches assume accurate demand forecasts and consistent lead times. In reality, of course, this rarely happens.
For starters, relying solely on historical sales to calculate demand often results in inaccurate forecasts – here are the best inventory forecasting techniques to prevent inaccurate forecasts. This is because each SKU in your inventory has a unique demand pattern. Some will have steady demand, while others will be more lumpy or erratic, which forecasts based on historical consumption alone cannot account for.
At the same time, lead times can be inconsistent due to issues such as production downtime or delivery delays.
By definition, a ‘one size fits all’ approach to calculating safety stock will deliver the right amount of inventory for some items, but excess or insufficient stock for others. Consequently, managers face inventory imbalances that can lead to excessive inventory costs and inconsistent service levels.
This can be seen if we look at each stock item in turn:
Mary’s forecasts indicated that the demand for Showerhead C could be much more erratic than for A or B, but she still chooses to base her safety stock on average weekly demand.
As we can see from the actual sales figures:

Showerhead A’s actual sales exceed the forecast, but the safety stock effectively covers the demand increase with 295 units remaining.
Showerhead B’s actual sales are slightly below forecast, creating a 290-unit surplus, comprising 250 units of safety stock and 40 units of excess stock, which ties up valuable capital.
Showerhead C’s actual sales also surpass the predicted forecast, but the safety stock falls short of covering actual demand in week four by 25 units. This causes a stock-out in week four and several expensive back orders.
For products with more erratic demand, higher safety stock levels are required, but how do you calculate the optimal level?
3. Average/Max safety stock formula
A more prudent approach is to use an average or maximum safety stock formula, which accounts for increases in lead times and peak sales.
Mary’s average lead time is 1 week, but it can be as high as 1.5 weeks. Using this information and her sales data from last month, she can calculate safety stock for each showerhead SKU:
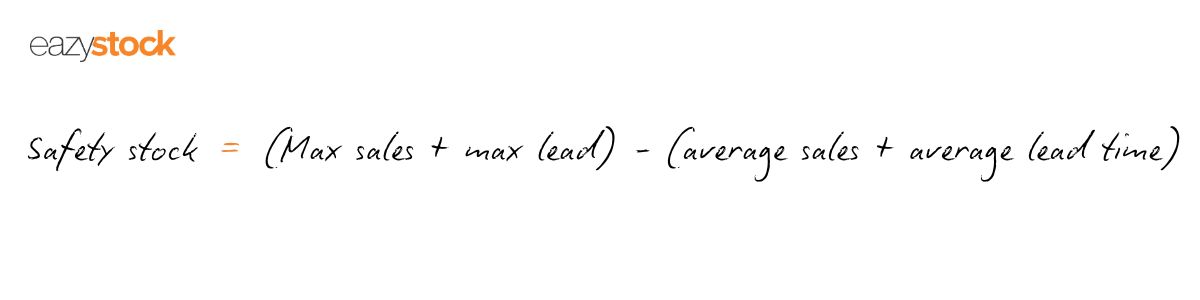
Shower head A: (630 x 1.5) – (582.50 x 1) = 362.50 units
Shower head B (300 x 1.5) – (240 x 1) = 210 units
Shower head C (900 x 1.5) – (600 x 1) = 750 units
Problems arise with this formula when the maximum lead time and sales are considerably higher than the average, leading to significantly inflated safety stock levels.

Statistical safety stock calculations
As we’ve seen, when demand is consistent and lead times are reliable, it’s fairly easy to determine safety stock levels. However, when demand and supply fluctuate, many inventory planners struggle to calculate safety stock accurately.
Too often, they rely on simple safety stock formulas that fail to address their specific supply-and-demand challenges.
Statistical safety stock formulas address many drawbacks of the three methods mentioned above. Instead of relying on historical consumption or sales data to forecast demand, they use probability distributions to model demand and account for variability.
A probabilistic approach to calculating safety stock acknowledges uncertainty in predicting future events, such as demand volume and frequency, and manages this by covering a percentage of all possible inventory requirements.
While the safety stock calculations become more complex, they are also significantly more accurate because they consider target service levels, forecast accuracy and forecast error, and lead time variability.
If this sounds like your next step to improving your safety stock calculations, please download our eGuide, which provides more detail on how to use statistical safety stock formulas.
Accurate safety stock calculations are critical to inventory management
The more accurate you can make your safety stock calculations the less likely you are to experience out of stock or excess stock situations.
Since buying inventory requires investing capital, it’s important to calculate safety stock levels as accurately as possible.
Many companies use simplified methods to calculate safety stock, foregoing accuracy. Basic formulas work well when demand and lead times are consistent, which often isn’t the case.
Adopting a sound, statistical approach to safety stock calculations ensures inventory levels balance the conflicting goals of maximising customer service and minimising inventory cost.
To understand more about how EazyStock inventory optimisation software can help ensure you have accurate safety stock levels, contact us today on 0121 312 2992 or request a demo.