
Reorder point formula – what every inventory planner needs to know

The reorder point formula
The reorder point formula works out when stock hits a level at which it’s the right time to reorder. It requires you to calculate your demand during your lead time, e.g. how much stock you think you will sell (or consume) on average each day. You then multiply this by the number of days of stock you want to carry. This is usually related to lead time, to ensure your reorder point is set at a level where there is enough stock to last until your next delivery:

The reorder point formula:
Demand is usually based on previous consumption data over an appropriate time period, e.g., the previous four weeks, six months, etc. The lead time is often driven by industry. For example, a retailer buying on shorter lead times and needing to react more to recent market trends would look over a shorter time period than a wholesaler, typically buying on a longer lead time with a more consistent customer base.
Safety stock is then added to account for any calculation inaccuracies, unexpected demand or lead time fluctuations.
How is the reorder point formula used?
When inventory planners calculate reorder points, they often decide how many days of stock e.g stock days they want to have left, before triggering the order. Calculations for reorder point planning are often done manually, in excel, and the data is then input into a stock ordering system, so it has the relevant parameters to create reorder alerts.

Let’s now take a closer look at the reorder point formula in a working example, discuss some of the problems associated with this calculation, and explain why it can result in poor stock availability across the supply chain.
Using the reorder point formula – an example
As an example, let’s imagine a business, ABC Autoparts, selling car parts from the Far East into the UK market. Imagine they sell on average 250 brake pads a week (approx. 36 a day) and their lead time is 28 days e.g they need at least 28 days’ of stock to prevent availability issues.
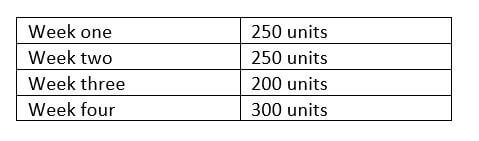
ABC Autoparts historic four-week consumption:
Reorder point = 36 x 28 = 1008 units
For an extra level of precaution, they also need to add safety stock. The easiest way to do this is to add a specific number of safety stock days to the reorder point, however there are more advanced ways to calculate safety stock.
Adding an extra week’s safety stock increases the reorder point value to 1258 units e.g 1008 + 250 = 1258 units.

Reorder point problems and solutions
Whilst simple to calculate and manage, there are fundamental flaws with a basic reorder point formula:
1. Using historic average consumption data often leads to inaccurate lead time forecasts
Using historic average consumption to calculate forecasts works well if you sell the same amount of each item in every lead time period. But if sales fluctuate over a couple of periods, then you’re going to suffer with either stockouts, or excess inventory.
Any demand forecast needs to consider the following factors:
- An inventory item’s position in its product life cycle, as this affects its demand pattern. For example, products nearing maturity should have fairly regular demand, whilst those nearing decline will see sales become much lumpier.
- Seasonal peaks and troughs in demand.
- Demand trends resulting from changes in consumer tastes or buying habits.
- Human feedback from sales teams and customers that offers valuable market insights.
Each of these factors is easy to miss when forecasting is based on rolling average consumption data. And this can lead to sold out lines or stock obsolescence.
Unfortunately, it’s extremely challenging and time-consuming to consider these factors when forecasting demand is a manual task. Plus, manual forecasts can quickly go out-of-date. Ideally forecasts need to be reviewed regularly and reorder point calculations updated accordingly, to account for market changes.
The most efficient way to do this is to use demand forecasting software. A tool, such as EazyStock, will automatically analyse historic demand data for each inventory item. It then assigns a demand type, based on its position in the product life cycle and a relevant forecasting algorithm. These are reviewed daily, along with indicators of seasonality and demand trends and forecasts are dynamically adjusted as required.
2. The reorder point formula is disconnected from customer satisfaction
Basing reorder points on a set number of stock days e.g average daily usage, has no connection back to customer service or customer satisfaction. Stock days is merely an accounting formula to help measure and track stock turnover. When used in purchasing, it will not help optimise stock levels.
Instead, replenishment activity needs to be linked back to a metric that focuses on stock availability.

That’s why more and more inventory management teams are beginning to use service level targets, based on stock availability.
For example, if ABC Autoparts sets their service level target for brake pads at 99%, this means they will be able to fulfil 99% of orders and only have to say ‘no’ 1% of the time. This allows their order fulfilment operations to be directly linked to their customers’ service experience. With target service levels set, they can then work out how much stock they need to carry to achieve them and set corresponding reordering parameters.
Whilst service level targets are easy to set, tracking and measuring whether they have been achieved is much more difficult to do manually. An inventory optimisation tool, such as EazyStock, is designed to do this work for you.
3. The reorder point formula presumes static lead times
The reorder point formula presumes that lead times are consistent, but this is not always the case, for example ABC Autoparts’ goods have a long distance to travel and shipping could get delayed. Bad weather, customs issues, supplier shutdowns and more recently pandemics are all events that can delay lead times and result in stock shortages and lost sales. Presuming average lead times are a constant is therefore unrealistic and will result in stock availability problems.
It’s key, therefore, to regularly review supplier delivery times and update reorder points to reflect the current situation. A good inventory optimisation tool will be able to track lead times automatically. If lead times then increase, the system will automatically adjust reordering parameters, ensuring you have the correct inventory levels to cover demand until the delivery arrives.
4. The reorder point formula uses over-simplistic safety stock calculations
You may be thinking that safety stock will act as the buffer against any fluctuations in demand or lead times. And this is true for items where demand and lead times are consistent and predictable, but not when they are more erratic.
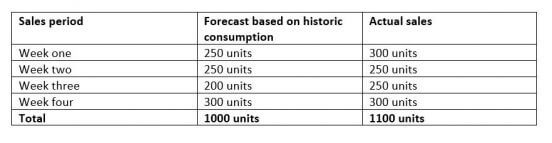
Let’s revisit ABC Autoparts. In the table below we can see that actual sales of brake pads only fluctuated between 250 and 300 units per week. This meant that one week of safety stock e.g 250 units, was enough to cover the increase in sales.
ABC Autoparts actual four-week consumption:
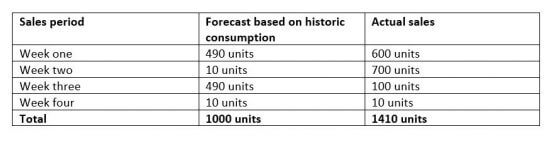
However, if we look at air conditioning units, the story is much different. ABC Autoparts predicted that possible demand would be much more erratic in their forecast, as sales often rise and fall with the British weather. But the average weekly predicted consumption still worked out to 250 units, so they kept the safety stock level at 250 units. As a consequence, ABC Autoparts ran out of stock in week two:
For items whose demand is more erratic, higher levels of safety stock are required, but how do you calculate the optimal level?
The answer is to use a formula with probabilistic distribution. Whilst a probabilistic safety stock formula would not help ABC Autoparts predict the weather, it would add a greater allowance for the fact that there will be a higher variance in demand for air conditioning units in the summer.
An inventory optimisation tool links safety stock quantities to target service levels, whilst also accounting for demand volatility. For example, using EazyStock, service levels for brake pads that have regular demand are likely to be higher e.g 99%, than air conditioning units at, say, 95%, where demand is more erratic.
The safety stock calculation in each instance will also be different. EazyStock uses different probability distributions to calculate safety stock depending on the demand characteristics of the product. In our example, the air conditioning units with highly varying sales volumes will use a different safety stock calculation than the brake pads, which have more consistent sales volumes. Using different calculations, tailored to the demand characteristics of each product, is the only way to achieve optimum stock levels and meet 99% and 95% service levels respectively.
Automating reorder points and safety stock levels
In reality, most stock items in your warehouse will have different demand characteristics, some being affected by seasonality, others by market trends. In addition, many lead times are not as reliable or regular as they used to be. Using a ‘one size fits all’ reorder point and safety stock formula to calculate replenishment needs will, therefore, lead to stock availability challenges.
Manually calculating safety stock and reorder points to input into your ordering system is a time-consuming task that quickly leads to outdated data being used to produce replenishment alerts. Instead, the answer is to connect an inventory optimisation tool. This will automatically do these calculations for you, based on the latest market dynamics, keeping your replenishment parameters as relevant as possible.
If you’d like to know more about EazyStock, please get in touch with our team for a no-obligation chat.