How to calculate forecast accuracy and forecast error

What is forecast accuracy?
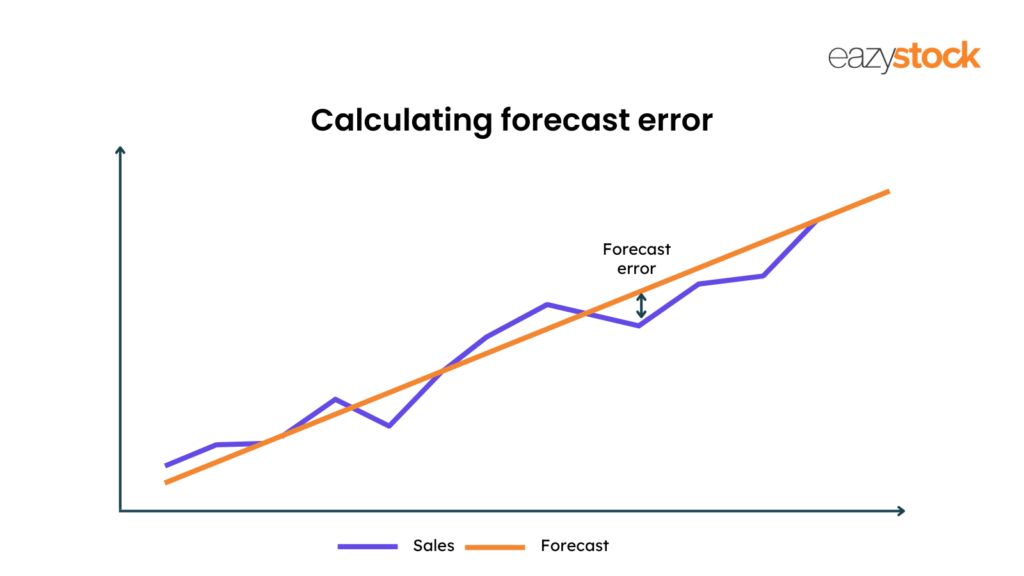
Forecast accuracy measures how close your demand forecast is to the actual demand value. You can use it with forecast error to see the accuracy of your demand forecasting methods. Forecast error is the difference between the actual demand and forecasted demand.
One way to check the quality of demand forecasts is to calculate forecast accuracy, also called forecast error. The forecast accuracy calculation shows the deviation of the actual demand from the forecasted demand. Understanding the error level in your previous demand forecasts can help you improve future forecasts and adjust plans as necessary.
Learn about how EazyStock can automate forecasting with high accuracy:
Why is measuring forecast accuracy important?
Accurate forecasts are vital for balancing inventory levels so you don’t hold too much or too little stock. Holding too much stock means money is tied up in stock that isn’t needed. This stock must then be sold at a heavy discount or written off completely.
Holding too little stock is also risky. You risk stockouts, lost sales and poor customer satisfaction, which could cause them to move to competitors with stock.
Demand forecasting is tricky at the best times, but with continuing complex global economic situations, it’s even more challenging. For more information regarding this topic, have a look at our blog with some advice on managing forecasts during fluctuating demand.
What is a good forecast accuracy percentage?
In a dream world, we’d all love to see 100% accuracy every time, but that’s unrealistic. There isn’t one figure that will work across all companies and industries, and numbers could vary across the year, so focus on getting it as accurate as possible. There are four things to remember when it comes to measuring forecast accuracy. You get more accurate forecasts when you:
- Have high sales volumes
- Have high aggregation levels
- Forecast for short periods, as changing market factors can impact long-term forecasts
- Have business stability.
How to calculate forecast accuracy – What are the three measures of forecast accuracy?
In this post, we explain how to calculate forecast accuracy using forecast accuracy formulas.
Inventory planners can use several forecast accuracy measures and forecast accuracy formulas when calculating forecast accuracy and forecast error. These range from the relatively simple to the complex.
The three most common forecast accuracy methods are:
- Forecast bias
- Mean absolute standard deviation – MAD
- Mean absolute percent error – MAPE
Let’s take a closer look at each:
1. Forecast bias
The forecast bias is essentially the difference between forecast and sales. If your forecast overestimated sales, this is considered a positive bias. When the forecast underestimates sales, the forecast bias is considered negative.
While the forecast bias shows whether your overall forecast accuracy was good, it doesn’t show how significant the error was when reviewing multiple items or long periods.
2. Mean absolute deviation (MAD) forecast accuracy calculation
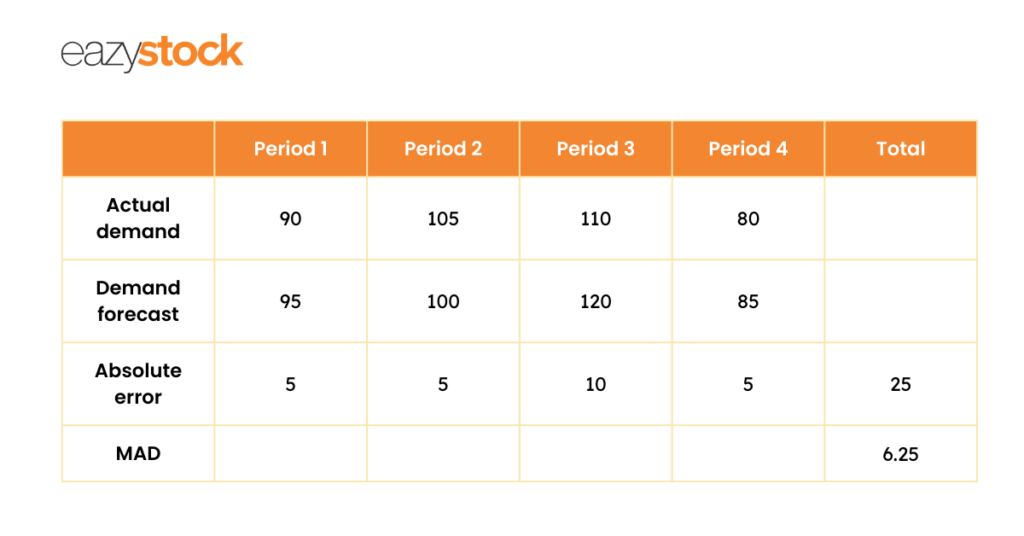
A common way to work out forecast error is to calculate the Mean Absolute Deviation (MAD). This shows the deviation of forecasted demand from actual demand in units.
The MAD calculation takes the absolute value of the forecast errors (the difference between actual demand and the forecast) and averages them over the forecasted periods. ‘Absolute value’ means that even when the difference between the actual demand and forecasted demand is a negative number, it becomes a positive. So 25 divided by 4 is 6.25.
The MAD calculation works best when using it on one product, as the demand error is not proportional. Using it on items with different volumes, particularly heavier volumes, will skew the result.
3. MAPE forecast accuracy calculation
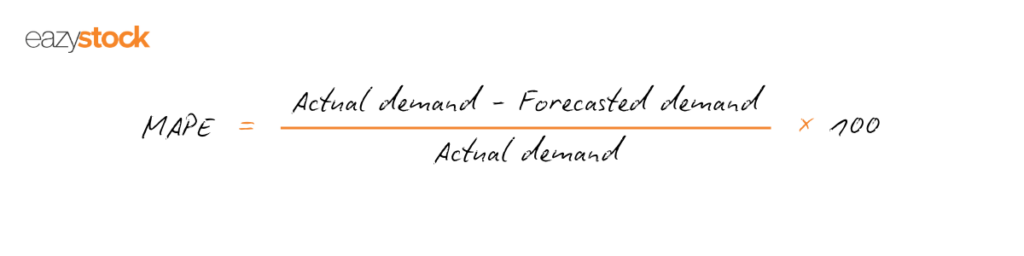
Another relatively simple way to calculate forecast error is to find your forecast’s Mean Absolute Percent Error (MAPE). Statistically, MAPE is defined as the average of percentage errors. The MAPE formula consists of the mean – M and the absolute percentage error – APE. The formula for APE is the difference between your actual and forecasted demand as a percentage:
Once you’ve calculated APE for each period, calculate the mean of all percentage errors.
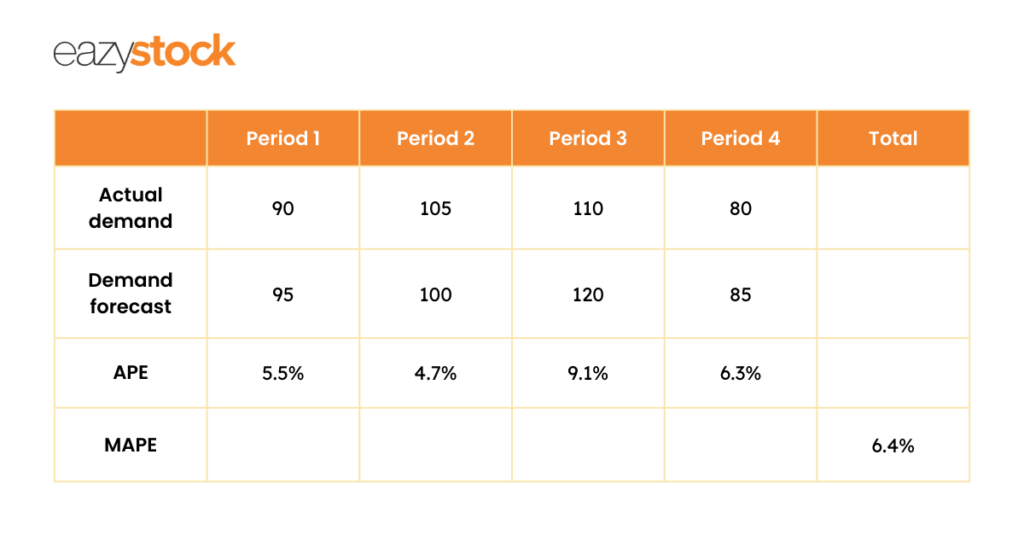
Since MAPE is a measure of error, high numbers are bad and low numbers are good.
These are the 3 main ways of measuring forecast accuracy, but there are other forecast accuracy calculations that you can use. It’s essential to find the most appropriate method for your needs and to improve your demand forecasting accuracy.
Calculating forecast accuracy is just a part of improving demand forecasting, ensuring overstock and stockouts are kept to a minimum. Find out how you can automate this process with demand forecasting software.
Using forecast error data for better demand predictions
Once you have your forecast error calculations, you need to use your forecast error stats to refine your forecasting processes and improve forecasting accuracy. You should include internal business decisions directly impacting demand, such as promotions and price changes.
More accurate forecasts will help improve your inventory purchasing and planning to ensure you maintain the right inventory levels.
You can do this in several ways:
1. Mitigate the risk of future forecasting accuracy: The forecast error calculation provides a quantitative estimate of the quality of your past forecasts. If you can calculate the error level in previous demand forecasts, you can factor this risk into future forecasts.
By determining a forecast’s uncertainty for a given future business period, you can adjust your inventory management rules, such as increasing safety stock levels and altering re-order points. This helps to cover periods of uncertain demand.
2. Prioritise questionable forecasts: Identifying and prioritising items with a high forecast error allows you to focus on them. This attention means you can closely monitor their future demand and adjust stock levels accordingly.
3. Refine and improve forecast accuracy: If you consistently see high forecast error rates, you must review and improve your demand forecasting technique and forecasting models. You can read more about this in our blog, which highlights eight demand forecasting techniques for better inventory management.
Measuring forecast accuracy/forecast error with automation
Instead of struggling to calculate the forecast accuracy formula manually in Excel, some Enterprise Resource Planning (ERP) and Warehouse Management Systems (WMS) can calculate forecast errors automatically. Every system will have a different level of complexity, so ensure you understand yours and account for its limitations. For example, is your system interrogating every SKU? What calculation is it using to forecast error? Is it adjusting stock parameters based on the results?
If your current inventory management system has limitations, consider investing in an inventory optimisation plug-in. Inventory optimisation software works with an ERP, WMS or inventory management tool to provide statistical demand forecasting functionality. This saves you from complex calculations and frees up time to review accurate forecast data and make informed inventory management decisions.
If your current systems and processes are making accurate forecasts a challenge, contact the EazyStock team today.
Our demand forecasting software provides advanced inventory management capabilities to improve your business’s day-to-day operations quickly.
For more information regarding forecasting, have a look at our other forecast accuracy related blogs:
Achieve even greater forecast accuracy
See how EasyStock works to provide high forecast accuracy without manual calculations
FAQs about calculating forecast accuracy and forecast error
Forecast accuracy and forecast error both measure the difference between actual demand and forecasted demand.
- Forecast accuracy measures how close the forecast is to actual demand and is usually expressed as a percentage to explain the overall quality of your demand planning.
- Forecast error is usually expressed numerically to show by how much your forecast differed from actual demand.
Benchmarks for good forecast accuracy vary by company and industry, so there isn’t a one-size-fits-all figure. However, anything above 85% could be considered ‘good’, but it’s important to understand why your accuracy is at this level. Investigate any critical failures or recurring issues to understand where you can improve.
There are three common measures of forecast accuracy:
- Forecast bias,
- Mean absolute standard deviation (MAD),
- Mean absolute percentage error (MAPE).
Mean absolute percentage error, or MAPE, is the average of percentage errors and is calculated by subtracting the forecasted demand from the actual demand, dividing that number by the actual demand and multiplying it by 100.
MAPE = (Actual demand – forecast demand) / actual demand x 100
The MAD calculation works best when applied to only one product, since the demand error isn’t proportional. When it’s used on items with different volumes, particularly heavier volumes, it will skew the result. For multiple items or at the portfolio level, MAPE works best.
There are four calculations that consider zero demand when calculating forecast error:
- Mean Absolute Error (MAE/MAD),
- Mean Absolute Scales Error (MASE),
- Weighted Mean Absolute Percentage Error (WMAPE),
- Mean Arctangent Absolute Percentage Error (MAAPE).
For most businesses with intermittent demand, a combination of MAW and MASE provides a balanced view.
Forecast bias is the difference between the forecast and sales. Positive bias comes from overestimating sales, while a negative forecast comes from underestimating sales. While it shows whether your overall forecast accuracy was good, it doesn’t show the significance of the error when reviewing multiple items or long periods.
As safety stock provides a buffer to cope with unexpected demand changes or supply issues, it is directly affected by forecast accuracy. More accurate forecasts mean that your stock levels will be more aligned with actual demand, so you can hold lower safety stock levels. Where forecast accuracy is low, more safety stock is needed to prevent stockouts and maintain target service levels, as the forecast data is unreliable.
Forecast lag refers to the forecast’s age when compared to actual demand. Shorter forecast periods tend to be more accurate as they will experience fewer changing market factors. Longer forecast periods are more susceptible to disruption. Align your lag with your planning and supplier lead times.
Fast-moving items will be better aligned to shorter lags, from one month to one quarter, to capture trends and minimise holding costs. Slow-moving items or those with long lead times are better suited to longer lags, particularly for manufactured items that require suppliers to purchase raw materials.