
Importance of ABC analysis in inventory management

ABC analysis in inventory management
Managing thousands of stock items from various suppliers and delivering them to an extensive customer base is challenging. To help control such complexity, businesses can introduce models to prioritise their inventory management. They can then apply a level of control to each group, based on their importance to the business. One way to do this is to use a model such as ABC analysis, also known as ABC inventory classification.
This blog post explores how businesses can use ABC analysis (ABC classification) to improve their inventory management and stock control practices.
What is ABC inventory analysis?
Inventory management teams use ABC inventory analysis (ABC inventory classification) to classify stock items into three categories – A, B and C – based on their ‘value’ or ‘importance’ to their business.
ABC analysis is a fairly simple way to help managers focus their time and efforts on controlling more significant stock items using demand and cost per unit. They can also adapt their inventory management processes and inventory control policies for each category to help ensure they carry optimised levels of the right stock.
Using ABC analysis for stock control
Every stocked item (or SKU) does not have the same value in a business. Some items will be more profitable, urgent or critical than others, requiring more focus on forecasting, management and replenishment activities. One way to help differentiate and prioritise items is to segment them into categories (A, B, and C).
ABC inventory classification ranks inventory items based on their usage value, such as sales or consumption. Usage value is calculated by multiplying an item’s ‘usage rate’ by its ‘individual value’ or its ‘sales volume’ by its ‘unit cost’. We explain this in more detail in our blog post, ‘How to calculate ABC classification – a working example.’
- ‘A’ classification items are very important and sometimes business critical. They require the most careful control.
- ‘B’ classification items are less important than ‘A’ items and more important than ‘C’ items.
- ‘C’ classification items are marginally important and need less attention and control.

ABC inventory analysis and the 80/20 rule
You’re undoubtedly familiar with the ’80/20 rule’, also known as the Pareto Principle. This rule of thumb can also be used for inventory consumption, where a few stock items make up most of the usage value.
So, A items are the 20% or so of items with a high usage value. These items account for around 80% of the total usage value.
B items are the next 30% of medium usage value items, accounting for around 10% of the total usage value.
C items are low usage value items that comprise around 50% of total stock, but contribute only 10% to the total usage value.
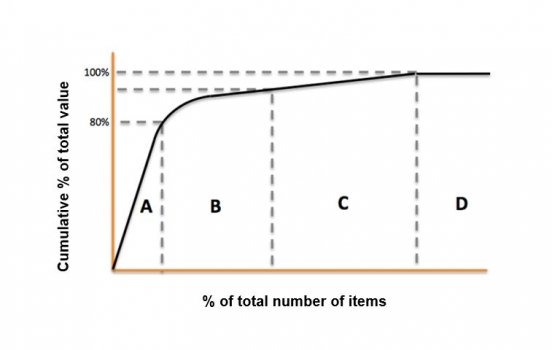
The graph below shows how ABC inventory classification conforms with the Pareto Principle. You can see that 80% of the inventory’s total usage value comes from a small number of A category items. The remaining 20% comprises a large number of B, C and D items. In this example, we have included category D items, as some companies may want to classify their inventory beyond, A, B and C.
While the Pareto Principle might not always be 100% accurate, ABC is an easy way to find where most of a business’s revenue comes from.
Other types of ABC stock analysis criteria
Although ABC stock analysis commonly uses usage value, it isn’t the only way to classify stock. You could decide to group inventory items based on other ‘operation critical’ criteria, including:
- Risk of stock-outs – how likely items are to be out of stock
- Consequences of stock-outs – this could be based on production delays or customer service levels
- Uncertainty of supply – items with erratic demand could warrant more attention
- Item deterioration risk – items at risk of going obsolete might need extra monitoring
The importance and advantages of ABC analysis
After analysing your stock and categorising each item, you can then use the information to improve stock control and management efficiencies.
Improved inventory management process
Inventory teams can improve how they manage their time. For example, they can focus primarily on managing category A items to improve their stock availability, update demand forecasts or review stock levels more frequently.
Inventory optimisation
Knowing which products have high demand allows you to ensure you invest in the right products: those you know will sell. You can also prioritise warehouse space for A items and reduce the risk of obsolete items taking up valuable space.
ABC analysis can help you determine appropriate inventory rules such as different service levels, safety stock levels and re-ordering parameters for each category. For example, improving order quantities or safety stocks of A items could lead to significant savings overall. Improving fulfilment rates of A items could also dramatically increase overall availability.

Improved supplier relationships
Understanding your most valuable items means you can develop relationships with suppliers of your A items. This could be improving lead times or negotiating prices.
Better product life-cycle management
Monitoring items as they move between categories can help you track where they are in their product life cycle – launch, growth, maturity or decline. This means you can adjust demand forecasts and maintain high service levels for each item.
Disadvantages of ABC analysis
While ABC analysis is a relatively easy way to prioritise inventory management, it also has several limitations:
Too simplistic
ABC analysis arguably oversimplifies inventory classification. Especially if you base the analysis on ‘gut feel’ and not hard data. ABC classes are also very one-dimensional as they only consider one variable, such as sales value. Factors such as demand variability, sales frequency and pick frequency are equally important when categorising your most important inventory.
With only three categories, ABC analysis lacks granularity. Having hundreds or thousands of items in one segment doesn’t mean they have the same characteristics, so they shouldn’t be treated in the same way.
Static
ABC analysis lacks dynamism. In a marketplace with varying trends and erratic product sales, items can quickly move from category C to B or vice versa. This means your ABC classification groups can quickly become outdate without regular analysis and reclassification. Treating A products as C products or visa versa can harm a business. It couldlead to out-of-date inventory policies and stockouts or excess inventory.
Time-consuming
It takes time to constantly re-evaluate your As, Bs and Cs and look for signs of movement between the groups. This puts you at risk of your ABC classification getting out-of-date quickly. Inventory management teams spend more time classifying their goods rather than acting on the implications of the results.
Considering demand in ABC analysis

You can take ABC analysis to the next level by including the demand variability of your items. This allows you to classify products based on their value and forecastability, e.g., how likely demand will vary from the forecast.
For example, some products will have a regular demand, whilst others will have intermittent demand. This additional insight helps you to make informed decisions about which products to stock and the corresponding safety stock levels.
In its simplest form this is known as XYZ analysis and adds further categories.
- X items – regular demand
- Y items – strong variability in demand
- Z items – demand is very irregular and difficult to predict
You could also cross-analyse usage value with pick frequency or the number of times an item is sold. This can prevent over-stocking of relatively high-value, slow-moving items that don’t sell quickly. It also ensures that low-value items that sell regularly are identified as ones to watch. These can be equally important, as sometimes these low-value items have high margins.
Automating ABC inventory analysis
There is a way to overcome the shortfalls above and use ABC analysis effectively as part of your inventory management processes. The answer lies in utilising software to analyse and categorise your inventory. Some ERP systems offer basic ABC and XYZ analysis functionality. However, you should invest in an inventory optimisation tool for more advanced capabilities.
ERP apps like EazyStock take ABC inventory analysis to the next level. EazyStock carries out multi-dimensional item categorisation that considers a range of variables, including:
- Value of annual usage – sales volume x unit cost
- No of picks – number of times picked over the year
- Demand volume – number of units sold
- Sales frequency – what % of historical periods have a sale
The result is a far more advanced inventory classification matrix. EazyStock then uses it to recommend inventory policies, providing service level targets and safety stock levels for each product category down to SKU level.
As EazyStock recalculates and updates the classifications daily, it sends alerts when products move between categories. This keeps segmentation in line with market dynamics.
For more information on how EazyStock can deliver advanced ABC analysis functionality download our eGuide, where we deep dive into this topic.
With the analysis and hard work done for you, you can then manage by exception, focusing on the categories or even SKUs that EazyStock suggests need your attention.
Request a personalised demo to see EazyStock in action and to discuss your inventory challenges.
Alternatively, try our new free tool. Simply drop your data in to get instant ABC classifications and exportable results.

Post first published on 10 July 2015, updated on July 2021, October 2023 and June 2024.
FAQs about Importance of ABC Analysis in Inventory Management
ABC inventory classification is based on the theory that all inventory shouldn’t be treated the same, as each item has a different value to the business. It follows the Pareto Principle, also known as the 80/20 rule.
The Pareto Principle states that 20% of stock accounts for 80% of the business. Therefore, it’s important to ensure that companies prioritise the most valuable items to the business.
There are five steps to calculating ABC classification or ABC analysis.
- Calculate the annual consumption value of each item using the calculation: annual number of units sold (per item) x cost per unit
- List your products in descending order based on this annual consumption value
- Add up the total number of units sold and the annual consumption value for each item
- Calculate the cumulative percentage of items sold and the cumulative percentage of the annual consumption values
- Set your thresholds for A, B and C categories. The threshold will be unique to your company and product mix, but is usually around 80%/15%/5%
ABC analysis prevents all items from being treated the same way in inventory management. Categorising them according to their importance to the business allows inventory management teams to focus on the most important items to ensure stock availability.
ABC inventory classification is based on the theory that all inventory shouldn’t be treated the same, as each item has a different value to the business. It follows the Pareto Principle, also known as the 80/20 rule.
The Pareto Principle states that 20% of stock accounts for 80% of the business. Therefore, it’s important to ensure that companies prioritise the most valuable items to the business.
There are five steps to calculating the ABC classification or ABC analysis.
- Calculate the annual consumption value of each item using the calculation: annual number of units sold (per item) x cost per unit
- List your products in descending order based on this annual consumption value
- Add up the total number of units sold and the annual consumption value for each item
- Calculate the cumulative percentage of items sold and the cumulative percentage of the annual consumption values
- Set your thresholds for A, B, and C categories. The threshold will be unique to your company and product mix, but is usually around 80%/15%/5%
A classification items are very important and sometimes business-critical. These typically have a high value or are sold in large volumes. Inventory control policies for A items include:
- Controlled monitoring of cycle counts and stock levels
- Accurate demand forecasts
- Optimised, automated reorder points
- Appropriate safety stock levels set to ensure high service levels and reduce the risk of stockouts
- Efficient warehouse planning to improve accessibility
- Regular reviews and reclassification
How frequently you perform ABC analysis depends on your industry and profile. While quarterly reviews are standard best practices, businesses with fast-moving items or volatile demand should increase their frequency to monthly.
Businesses with slow-moving or consistent demand could extend their reviews to once a year. However, continuous, automated reclassification using inventory optimization software will provide the most accurate classifications, recommended order quantities, and reorder points.
Standard ABC classification is one-dimensional and can be oversimplistic, as it prioritizes items based solely on their value. While this influences the inventory you carry and focuses your time, it doesn’t factor in demand variability. As standard ABC classification is static and provides a snapshot of a single moment, it’s ineffective for new or seasonal items and could incorrectly classify them. XYZ analysis helps classify products based on their demand variability.
- X-items have regular demand with reliable demand forecasts
- Y-items don’t have steady demand, leading to substantial demand variability
- Z-items have very irregular demand that is difficult to predict
ABC XYZ analysis informs inventory management processes to set optimal order schedules and service levels. However, continuous, automated reclassification using inventory optimization software will provide the most accurate classifications, recommended order quantities, and reorder points.
ABC analysis allows warehouse managers to allocate storage space depending on value to the company. This ensures that fast-moving, frequently picked goods A items are easily accessible and near packing stations, making picking and packing more efficient.
Slower-moving C items would be on higher shelves or farther from packing areas. Warehouse space can be freed up by reducing the quantity of lower-value C items, freeing up space for more important A items.