
The Economic Order Quantity (EOQ) Formula Explained

The economic order quantity model is used in inventory management to support replenishment activity, but how useful is it in reality? Can such a simple formula really be applied to today’s complex supply chains? We’ll find out in this post.
What is the economic order quantity (EOQ) formula?

In inventory management, the economic order quantity (EOQ) is the optimal reorder amount that minimises the total costs of ordering and carrying stock. We review the economic order quantity formula or the Wilson Formula in more detail later in the blog, but, in short it considers the cost of ordering inventory and storing it. It then identifies the order quantity where both are at their lowest.

Why is the economic order quantity formula important?
Calculating the economic order quantity of stock items can help you reduce inventory costs. Holding costs (carrying costs) are the costs to store inventory, including the storage space, rent, property tax, insurance, item deterioration and obsolescence etc. The more inventory you order and carry, the higher the holding costs.
Ordering costs are the costs that arise every time you order inventory. They include the costs of creating a purchase order, processing an order, receiving and inspecting the goods etc. You’ll incur ordering costs no matter the order size, but the ordering costs will be higher the more orders you place.
The economic order quantity calculation helps balance these two conflicting costs.
How do you calculate the economic order quantity (EOQ)?
The economic order quantity formula allows you to calculate where your ordering and holding costs are minimised; in fact, it’s at this point where the costs are equivalent.
The graph below illustrates how the annual ordering costs and holding costs change as the reorder quantity increases; the EOQ is marked as the lowest point of the total cost line.

A working example of the economic order quantity
To calculate the economic order quantity, you need to know:
- the annual demand for the item
- the cost per order
- the carrying cost per unit of inventory
You can then plug these numbers into the Wilson Formula, also known as the economic order quantity formula:
Where:
D = demand per year
Co = cost per order
Ch = cost of holding per unit of inventory
Let’s look at an example of calculating EOQ:
Let’s imagine you’re a toy distributor, and one of your best sellers is a spinning top.
- Demand per year – Your annual demand for spinning tops is 15,000.
- Cost per order – Once you factor in the cost to create, place, validate, track, and receive orders, the ordering costs come to £20 per order.
- Holding cost for each spinning top – Including rent, storage space, insurance, etc. – comes to £0.50 per unit.
D = 15,000
Co = £20
Ch = £0.50
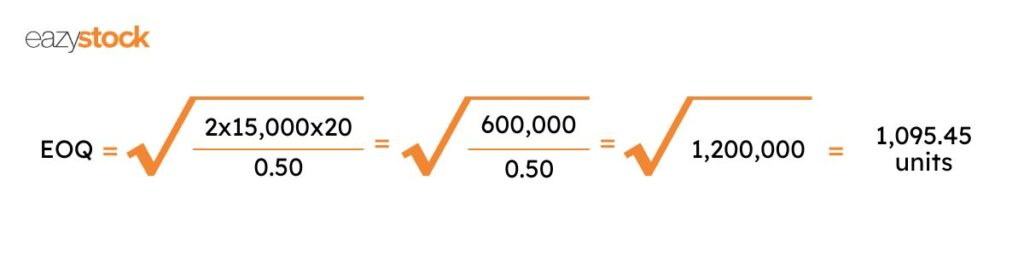
This means the EOQ for spinning tops is approximately 1,096 units per order. With an annual demand of 15,000 units, you’ll place orders with your supplier approximately 14 times per year.
Assumptions when calculating economic order quantity (EOQ)
Whilst the economic order quantity formula is a relatively simple way to calculate your reorder points, there are several factors to consider when using it:
- If your demand isn’t consistent and varies considerably, which is likely given our fluctuating economic situations, ordering simply based on cost-effectiveness may lead to stockouts when demand rises, and excess stock when demand falls away.
- If your purchasing team and warehouse staff cannot manage the frequency of orders recommended by EOQ calculations, you will struggle to meet orders.
- If your inventory items vary in value and importance to the business, their reordering parameters should not all be the same, which you can read more about in our ABC classification blog.
- If you have minimum order quantities to hit with certain suppliers, ordering based on the EOQ may not be possible.
- If your suppliers’ lead times aren’t always to schedule, you may need to regularly adjust safety stock levels to prevent stockouts when deliveries are late.
For more details about these assumptions, read our post, the problem with the economic order quantity model.

Making the economic order quantity formula work for your business
If you decide to base your reordering processes on EOQ calculations, you need to ensure you’re constantly monitoring and updating the data you input into the formula, ie. demand, cost per order and holding costs.
You also need to be sure that your internal operations and supplier network are happy to accommodate the number of orders stipulated in the calculations.
Calculating the economic order quantity for potentially thousands of SKUs manually, without software will be very time-consuming. It will also inevitably lead to replenishment errors and, consequently, stockouts or excess inventory levels. You may, therefore, want to find an inventory management solution or enterprise resource planning (ERP) platform that will calculate the EOQ for you.
An alternative to economic order quantity calculations
If you’d like to overcome the EOQ model’s limitations and investigate alternative ways of calculating your reorder points and quantities, you could consider investing in an inventory optimisation tool, like EazyStock. EazyStock will tell you what to order and when, basing calculations on a range of supply and demand variables, including:
- Demand forecasts – which consider demand volatility, an item’s position in its product lifecycle, seasonality and trends.
- Supplier lead times – automatically adjusting reorder quantities to cover variable lead times
- Current stock – including stock in warehouses, stock on order and in transit, and safety stock levels.
- Supplier restrictions – including minimum or maximum order quantities.
For more information or to book a free demo, contact us today.

FAQs about economic order quantity (EOQ) formula
The economic order quantity (EOQ) is the most cost-efficient stock ordering method because it determines the order quantity that minimizes total inventory holding and ordering costs.
The EOQ is important because it minimizes inventory costs and reduces the amount of capital tied up in inventory, thereby improving cash flow. Companies can reduce excess stock, prevent stockouts, and improve customer satisfaction while maximizing warehouse efficiency.
The EOQ formula is also known as the Wilson formula.
The Economic Order Quantity (EOQ) is the square root of ((2 x Demand per year x cost per order)/cost of holding per unit of inventory).
The EOQ reduces total inventory costs by identifying the order level that minimizes the sum of inventory holding and ordering costs. As it prevents over- and understocking, it minimizes further expenses, such as lost sales or additional holding costs.
Ordering and holding costs are two of the biggest expenses in inventory management. In the EOQ model, there is an inverse trade-off: as the order quantity increases, ordering costs decrease, but holding costs increase.
Where there are smaller, more frequent orders, ordering costs increase while holding costs decrease. The EOQ is the point at which the two costs are equal to minimize total cost.
Annual holding costs = (order quantity/2) x annual holding cost per unit.
The annual holding cost per unit comprises storage, capital, service, and risk costs, such as depreciation, obsolescence, and shrinkage. Add these together and divide by the average number of inventory units.
The EOQ model assumes a constant, known demand rate. When demand fluctuates, the EOQ cannot accurately balance holding and ordering costs, which can lead to stockouts or excess inventory. The EOQ only tells you how much to order, not when, so this will affect reordering.
For items with volatile demand, it’s better to use advanced models that account for demand variability and probability. To keep the calculation accurate, integrate safety stock and use dynamic reordering.
The EOQ assumes a constant, known demand rate, fixed reorder points, fixed ordering and holding costs, no stockouts, constant unit prices, fixed lead times, and one-batch delivery.
The Economic Order Quantity (EOQ) is a calculation that aims to minimize costs, whereas the Minimum Order Quantity (MOQ) is a minimum order quantity imposed by a supplier, which is out of a company’s control.
While the EOQ aims to reduce excess stock, minimize costs, and improve stock availability, the MOQ can lead to inefficient orders that increase excess stock and inventory costs. The EOQ can help to identify uneconomical MOQs.
While there isn’t a set schedule for recalculating EOQ, as it depends on company and industry factors, quarterly recalculations provide a good basis. However, you might need to adjust this depending on industry volatility, product lifecycles, or seasonal demand.
You should also recalculate EOQs when you see significant demand changes, suppliers change their prices, whether for inventory or shipping, if holding costs increase, and as products move through their product lifecycle. It’s essential to recalculate EOQs regularly to avoid stockouts or excess stock.
Combining ROP with EOQ creates a balanced, automated inventory system. As the EOQ only calculates the optimal order point of how much to order, adding the ROP will tell you when to place the order. This rounded inventory view minimizes costs while ensuring stock availability when needed.
The EOQ becomes inaccurate during supply chain disruptions because it assumes constant demand and stable, predictable lead times and costs, which aren’t true during disruptions.
Without regular recalculations, there is a risk of stockouts, increased inventory costs, limited cash flow, missed sales, excess stock, and unsatisfied customers.