14 Supply chain and inventory management KPIs to improve performance in 2026

Inventory management KPIs for effective stock management
Managing inventory is a complicated process. Many activities, processes, and people are involved in ordering, receiving, storing, picking, and shipping items, all aimed at ensuring On-Time, In-Full (OTIF) orders and maximising customer satisfaction.
The right supply chain KPIs are crucial because they help teams analyse and monitor the performance of inventory management activities, spot issues early, improve service levels, and remove guesswork around how stock is ordered, managed, and sold. With the right inventory management data, you can track progress toward supply chain objectives and support strategic, data-driven decisions.

From demand forecasting and replenishment activity to turnover rates and fulfilment performances, these key performance indicators for supply chain management provide the visibility needed to optimise stock levels and reduce costs. With many KPIs available to help monitor your process performance, how do you choose the right ones for your business? Below, you’ll find a practical guide to selecting, setting, and acting on the most important supply chain KPIs.
What inventory management KPIs should you track?
Every business is unique and has different goals, but here are some tips to help you choose the best ones for you.
- Select supply chain KPIs that add value and enhance your inventory management efficiency.
- Align KPIs with your strategic business goals. For example, focus on improving cash flow, customer service targets, growth strategies, or profitability objectives. When planning your objectives, consider what information you’re missing and what questions your board might ask, so you can choose KPIs that will provide the answers.
- Don’t focus only on the internal environment. Consider your customers and their satisfaction to ensure they keep coming back.
- Consider whether your inventory management systems can provide these supply chain management KPIs or if you need to upgrade or invest in additional software.
How to set key performance indicators for supply chain management
Supply chain performance indicators should be SMART – specific, measurable, achievable, relevant, and timely – so avoid setting targets that are too broad or difficult to quantify. Instead of saying, “We’d like to increase our stock turnover, it becomes, “We’d like to increase our stock turnover by 2% by the end of this year.
Supply chain KPIs will influence how employees perform their jobs, so ensure the metrics you choose will promote the right teamwork and don’t encourage competition between departments.
Once your KPIs are in place, you need to track and communicate regularly across your business. Your business or inventory management system should be able to help with this. Ensure employees understand the importance of KPIs and how they contribute to their performance. Offer praise when you’re performing well and constructive feedback when performance needs to improve to keep everyone motivated towards the same goal.
Inventory management KPI examples
Supply chain KPIs can be grouped into four categories:
- Financial – Carrying costs, inventory turnover, stock-to-sales ratio, Days Sales of Inventory (DSI), and Inventory Days on Hand (DOH)
- Customer service – Service level, stockout rate, backorder rate, perfect order rate, and rate of return
- Operational efficiency – Order cycle time, pick/pack/dispatch accuracy, and inventory shrinkage
- Planning quality – Demand forecast accuracy and sell-through rate.
For each inventory management KPI, we explain what it tells you, how to calculate it, what steps to take if it’s off, and common pitfalls.
1. Inventory carrying cost
What it tells you:
As a supply chain KPI, carrying cost reveals how efficiently capital flows through the supply chain and highlights inefficiencies that slow replenishment. The true cost of holding inventory, including capital, storage, service, and risk, expressed as a percentage of average inventory value. Lower values are better; aim for between 15% and 20%.
Formula:
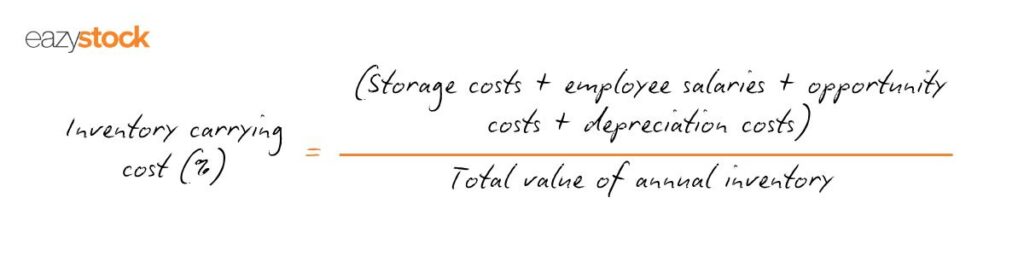
- Capital costs = all expenses related to investing in stock purchases, such as the cost of the stock, the interest on working capital, and the opportunity cost of the invested money.
- Storage space costs = warehouse rent or mortgage and maintenance expenses, such as lighting, heating, and air conditioning.
- Inventory service costs = insurance, security, IT hardware, and physical handling of goods.
- Inventory risk costs = cover the risk of items losing value while stored, experiencing shrinkage, or becoming obsolete.

If it’s high:
- Enhance warehouse and inventory management efficiency to save space and lower handling costs.
- Increase order frequency to lower average inventory levels and renegotiate MOQs.
- Keep goods flowing efficiently through your warehouse and avoid excess inventory and obsolete stock.
Watch out:
Old inventory isn’t ‘free inventory’. The longer it sits in your warehouse, the more space it takes up and the more cash you tie up.
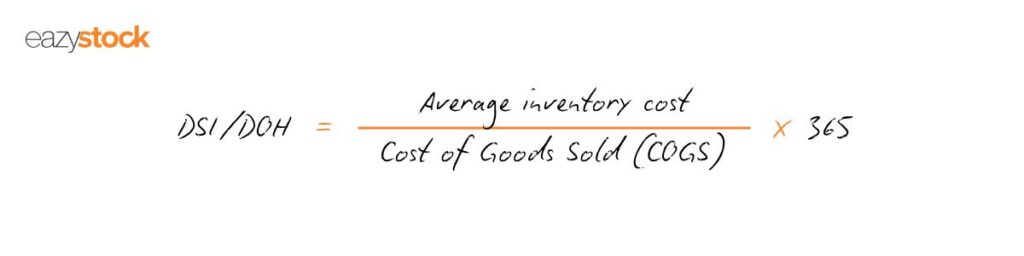
2. Days sales of inventory (DSI) and inventory days on hand (DOH)
What it tells you:
This shows the average number of days you hold inventory before it is sold, which reflects how long it takes to free up cash. A lower number is better, as it indicates you are not holding stock longer than necessary and are freeing up cash faster.
Formula:
If it’s high:
- Reduce order quantities and ensure safety stock levels are calculated based on variability, not intuition.
- Improve lead-time reliability with suppliers by using actual, realistic calendars to prevent excess and obsolete stock.
- Improve demand planning and forecast accuracy by accounting for seasonality, promotions, and trends to order the stock you need, when needed.
Watch out:
Keeping stock for a long time to meet unexpected orders isn’t cost-effective. It takes up space for items that will sell more quickly and could become damaged or out of date, so they won’t sell. Instead, they will be written off, affecting your bottom line.
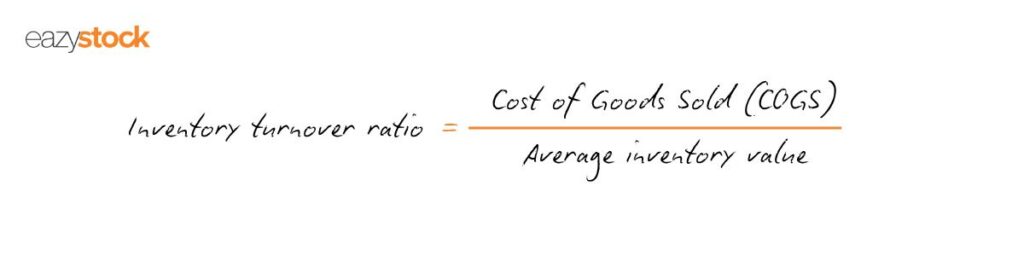
3. Inventory turnover ratio
What it tells you:
The inventory turnover ratio measures how quickly stock is sold and replaced (turned over) within a specific period – usually a year. Higher turnover figures indicate efficient inventory management, provided fill rates remain strong.
Formula:
If it’s low:
- Focus on slow movers; adjust their min/max, discontinue, or consider bundling and alternative sales strategies.
- Implement smaller, more frequent orders, renegotiate supplier agreements, or seek alternative suppliers.
- Automate replenishment to allow quicker responses to demand shifts.
Watch out:
However, be cautious not to reduce inventory levels throughout the entire warehouse just to increase your turnover rate, as this can harm order fulfilment.
Similarly, don’t bulk buy items without matching demand. Buying 500 units and only selling 100 indicates slow, stagnant turnover and results in a 400-unit cash trap.
Read our eGuide on How to fix inventory turnover challenges for more tips.
4. Backorder rate
What it tells you:
The backorder rate shows the share of orders (or lines) you couldn’t fulfil immediately due to stockouts. Lower rates are better for customer experience and revenue retention. High rates indicate poor demand forecasting and planning.
Formula:
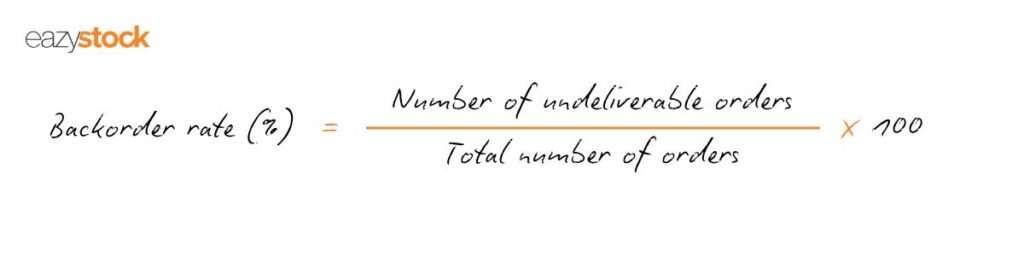
For precision, also track at the line level when orders contain multiple SKUs.
If it’s high:
- Improve forecast accuracy, especially for SKUs with volatile demand, and review service levels by ABC Class.
- Strengthen supplier reliability and buffer policies for long or variable lead times.
- Offer substitutes to protect the sales.
Watch out:
Backorders do not guarantee sales; up to 40% of customers might shop elsewhere for the remaining items rather than return to you.
5. Order cycle time
What it tells you:
This is one of the most widely tracked supply chain performance indicators, as it directly affects lead times and end‑to‑end supply chain responsiveness. Order cycle time measures the period from when a customer places an order to when they receive it. It shows how efficiently you prepare and process orders. Faster cycle times enhance customer satisfaction, increase conversion rates, and foster loyalty.
Efficient processes or automation mean you can handle frequent orders, which lowers your inventory levels, reduces carrying costs, and boosts your turnover ratio.
However, replenishment can be restrained by suppliers’ ordering stipulations regarding order frequency and minimum order quantity.
Formula: Count days from the day an order is placed to the day it arrives with the customer. Consider internal processing, if the item is in stock, backorder time, and delivery time.
If it’s high:
- Review internal processes; reduce manual efforts through automation, optimise warehouse layout, and pre-pack fast-movers.
- Work with carriers on pick-up windows and service levels.
- Enhance demand forecast accuracy and assess supplier lead time service levels to prevent delays.
Watch out:
Loyal customers won’t wait for your stock if they can get it elsewhere faster. Time is money, and if your lead time is too long, they will find someone else who can deliver more quickly.
6. Demand forecast accuracy
What it tells you:
Demand forecasting accuracy tells you how close your forecast was to actual demand. Smaller gaps show accurate forecasts, which ensure stock availability, maximise sales, keep customers happy, and prevent excess stock. Accurate demand forecasts also boost your inventory turnover rates and lower your carrying costs.
Formula: There are two main formulas:
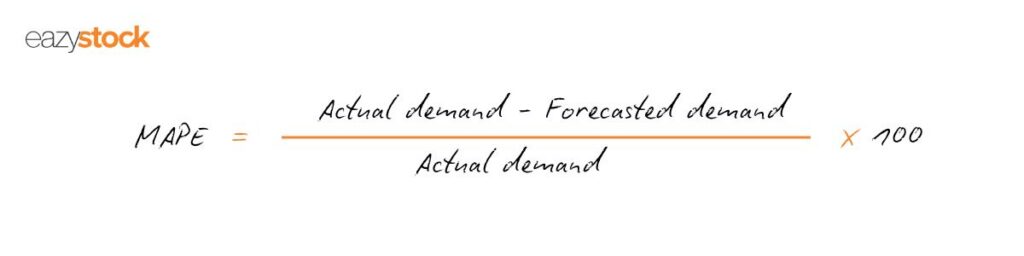
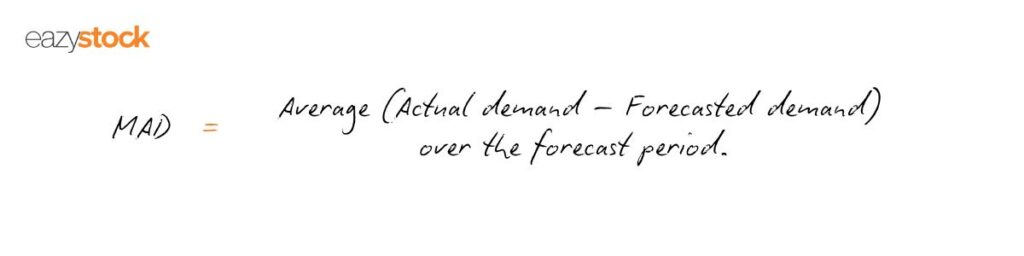
We explain in more detail in our blog post on calculating forecast error.
If accuracy is poor:
- Model seasonality, trends, and promotions instead of using rolling averages.
- Segment based on demand patterns and select the most suitable forecasting algorithm.
- Consider investing in inventory optimisation software to automate and dynamically forecast your demand with advanced forecasting algorithms.
Watch out:
We don’t live in a perfect world with constant demand. Economic conditions keep changing, and if your forecasts ignore trends, seasonality, promotions, and other factors, they won’t be accurate. As a result, your replenishment will be off, leading to incorrect stock quantities.
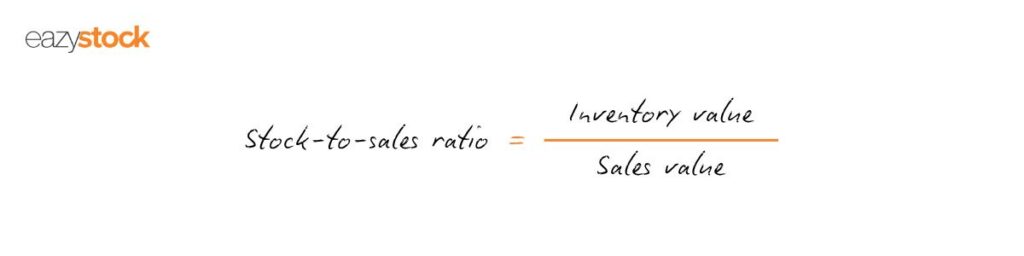
7. Stock-to-sales ratio, inventory-to-sales ratio
What it tells you:
The stock-to-sales ratio evaluates the health of your inventory levels by comparing the amount of stock available for sale to the amount you have already sold.
You can use this ratio to continuously optimise your stock levels, lower holding costs, improve cash flow, maintain high margins, and lessen the risk of stockouts.
Formula:
If it’s climbing:
- Reduce purchases in slow categories; reallocate budget to top performers.
- Improve markdown cadence on aging SKUs.
- Adjust reorder points and service levels based on ABC classification.
Watch out:
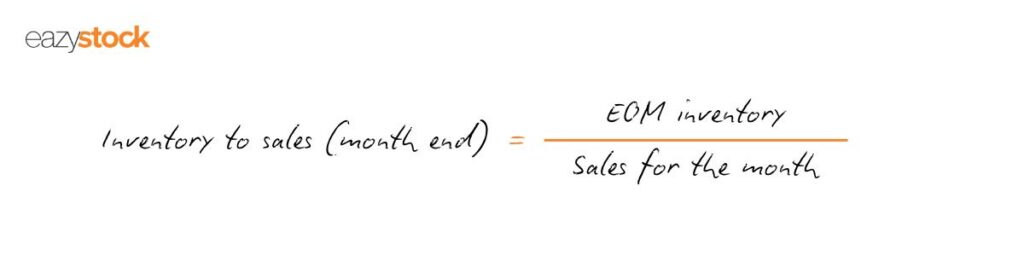
The inventory-to-sales ratio shows the remaining inventory at the end of the month after sales. Highlighting rising stock levels relative to declining sales helps you adjust replenishment and ordering to avoid potential cash flow problems.
It also assists in calculating replenishment quantities to fulfil demand. forecasts without using backorders.
8. Sell-through rate
What it tells you:
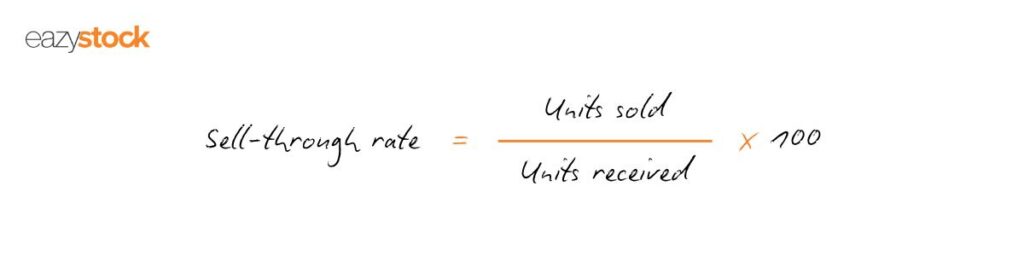
The sell-through rate shows how much inventory you sell compared to what you receive from a supplier. This helps you gauge demand forecasts, identify popular products, and control storage costs, all of which enhance your understanding of supply chain efficiency.
Formula:
If it’s low:
- Make smaller initial purchases and test new product lines with smaller orders.
- Coordinate promotions with suppliers; negotiate RTV or consignment terms to manage risk.
- Improve product discovery and the availability of substitutions.
Watch out:
Strong supplier relationships are key to providing quality service. Knowing where you’re over- or under-ordering allows you to improve those relationships by submitting more accurate sales orders. This helps prevent rush orders that cause unnecessary stress for you and your suppliers.
9. Rate of return
What it tells you:
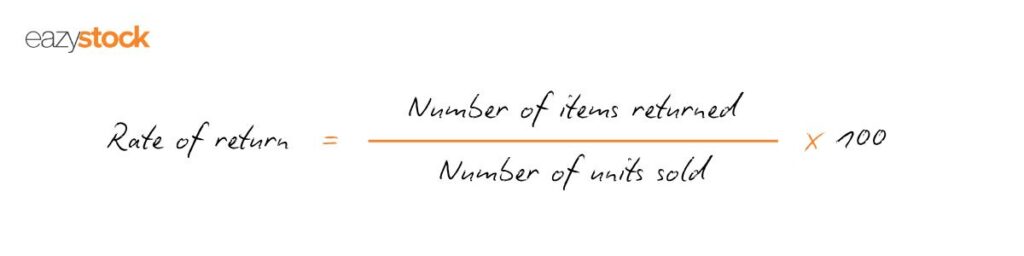
This simple KPI tracks the percentage of orders that are returned. You should keep it as low as possible to provide good customer satisfaction.
For effective inventory analysis, break this down by reason for return to identify and address root causes. For example, it could be a quality issue, an incorrect item being sent, or a growing social trend.
Formula:
If returns are high:
- Improve product data (images, specifications, fit, and compatibility).
- Improve pick accuracy and packing standards.
- Use post-purchase communications to set expectations and decrease remorseful returns.
Watch out:
When calculating the return rate, include exchange data to gain better insight into profitability. Don’t confuse the rate of return with inventory turnover; high return levels can slow down inventory turnover, leading to misinterpretation of high product dissatisfaction as poor sales performance.
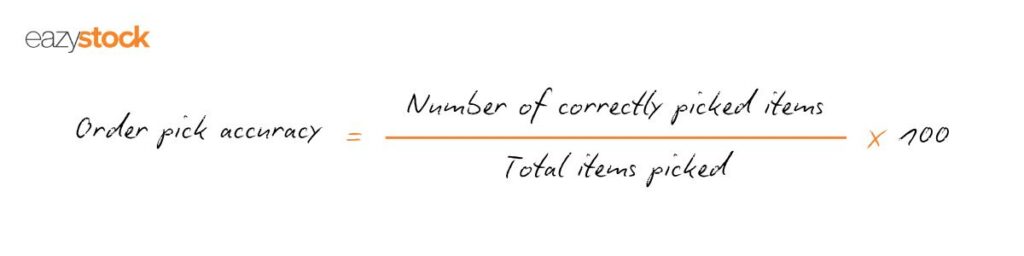
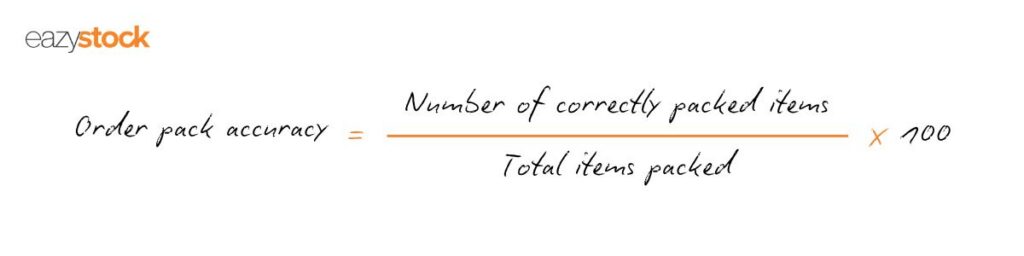
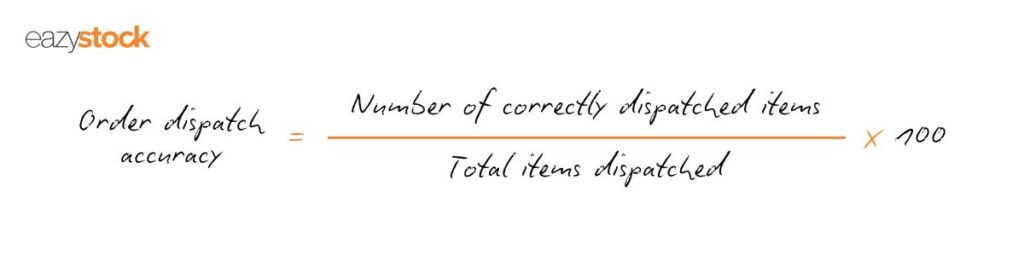
10. Order pick, pack, and dispatch accuracy
What it tells you:
This KPI shows how smoothly warehouse operations run at each stage and highlights areas needing improvement. Accuracy prevents rework, returns, and unhappy customers. These inventory management KPIs can be as broad or detailed as needed and as systems permit. Since locating items, packing, and shipping are core warehouse functions, tracking the efficiency of each step is essential for boosting productivity.
Formula:
If accuracy is slipping:
- Implement barcode scanning at each hand‑off to identify where errors happen.
- Rearrange your warehouse to give high-turnover items more prominence to reduce travel and touches.
- Add double‑checks for similar SKUs (look‑alikes/near‑SKU).
- Establish and clearly communicate the pick, pack, and dispatch processes.
Watch out:
Don’t sacrifice accuracy for speed. Prioritise accuracy first to minimise mistakes and the costs of fixing them.
11. Service level
What it tells you:
Service level is a core supply chain management KPI because it measures how well the supply chain supports customer demand without interruption. Service level indicates the probability of fulfilling demand from on-hand stock and whether an item was out of stock when ordered. It’s one of the key KPIs for tracking customer satisfaction and revenue.
Formula:
Initially, you should set your desired service level based on how essential the stock item is to your business (how much revenue or profit it generates) and its forecasted demand and volatility.
- Assign higher service levels (~99%) to profitable, steady sellers
- Assign lower service levels (~85%) to low-margin items with intermittent demand.
- Use ABC analysis or other inventory classification models to categorise based on value and volatility.
If it’s low:
- Monitor service levels as order transactions happen and report the actual figures versus the target.
- Consider using inventory optimisation software’s advanced algorithms to set service-level targets that account for lead times and incorporate supply and demand factors to determine which orders will be fulfilled.
- Don’t rely on manual calculations and average demand, as they ignore real-world factors and can cause excess stock or stockouts.
Watch out:
Ensure you’re counting the correct figures when determining if an order was fulfilled. If you record the order as 100% fulfilled because you shipped the items you had in stock, that masks the actual, lower service level.
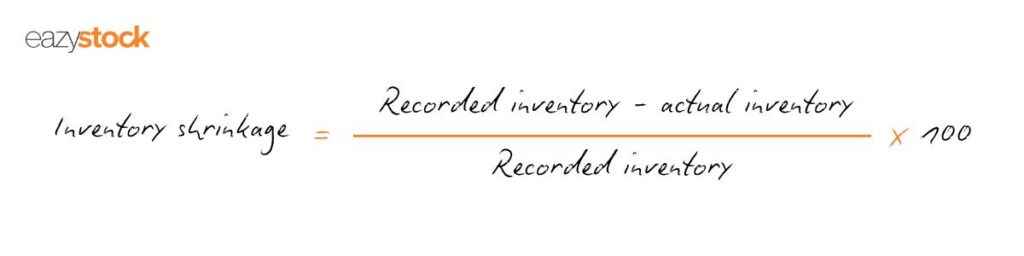
12. Inventory shrinkage
What it tells you:
Measuring shrinkage helps you quantify inventory loss from theft, damage, or error and to spot issues with inventory order accuracy and control. It also stops you from listing out-of-stock or unsellable items.
Formula:
If it’s high:
- Increase cycle counts for high-value items and promptly investigate issues.
- Establish secure zones for small and high-value items and improve packaging to minimise damage.
Watch out:
For every unaccounted unit, you’re losing money. Regularly check inventory levels frequently to ensure you’re not promising items you don’t have and pushing customers to competitors.
13. Perfect order rate
What it tells you:
The perfect order rate is the percentage of orders delivered on time, in full, undamaged, and with accurate documentation to measure operational efficiency and customer satisfaction. Strive for 95% when possible.
Formula:
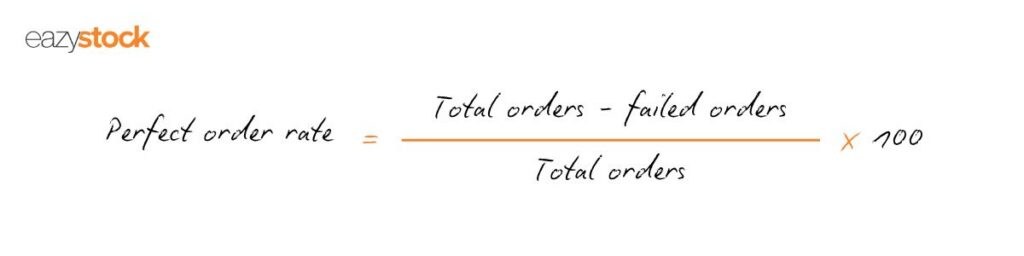
A POR of 95% or higher reduces costs, prevents returns, and increases customer loyalty.
If it’s low:
- Identify and address the top two or three causes.
- Implement strict SLAs for suppliers and carriers and track their performance.
Watch out:
A high perfect order rate doesn’t guarantee a good customer experience if they need to return the product. Use the perfect order rate along with order pick, pack, and dispatch accuracy, since improving the POR can slow down picking or packing. It can also raise costs if more durable packaging is required.
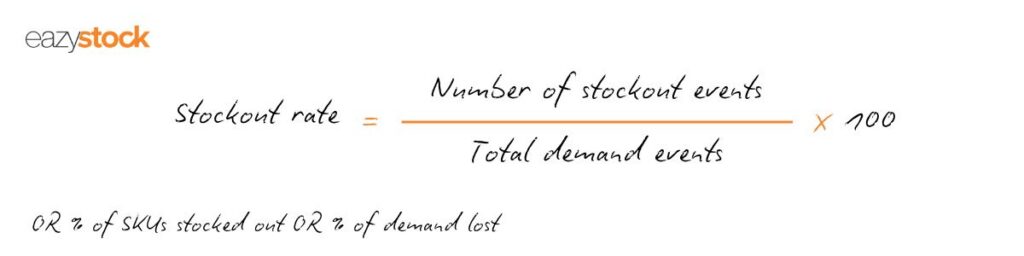
14. Stockout rate
What it tells you:
The stockout rate shows how often demand can’t be fulfilled due to a lack of items. High stockout rates suggest poor and inaccurate forecasting methods.
Formula:
If it’s high:
- Reevaluate safety stock for items with high demand variation and shorten review intervals.
- Improve supplier lead-time accuracy; are you working with actual times rather than expected?
- Expand supplier portfolio for high-risk items.
- Use substitutes and back-in-stock alerts to prevent losing the sale.
Watch out:
If customers can’t access the items they need when they need them, they’ll look for other suppliers. If they switch, they won’t just buy that one item; they’ll take their entire basket there. If they get good service and don’t face stockouts, the supplier is likely to keep their business.
Inventory management KPIs that will optimise stock levels
To turn KPIs into momentum for driving inventory efficiencies, saving time, and freeing up capital, follow these steps:
- Choose a few KPIs that directly relate to cash flow, customer satisfaction, and operational efficiency.
- Build a KPI dashboard by category that you can review easily on a regular basis. Reviews should be more frequent for fast-moving SKUs.
- Segment your inventory with ABC XYZ classification. Use this to determine suitable service levels and safety stock levels.
- Close the loop. Review outliers and exceptions, and proactively monitor their impact on cash, margin, and customer metrics.
- Automate your forecasting and replenishment processes to minimise errors and respond more quickly to changes.
How EazyStock helps
If your ERP’s planning tools are limited, inventory optimisation can automate demand forecasting, service levels, reorder points, safety stock, and replenishment while tracking KPIs. This reduces carrying costs, improves turnover, and safeguards your service level.
If you’d like to learn more about how EazyStock inventory optimisation software can transform your inventory from a cost centre into a competitive advantage, please get in touch or download our KPIs eGuide.
The most important KPI for inventory management is the inventory turnover ratio. This measures how quickly stock is sold and replaced – turned over – in a predefined period, usually a year.
Inventory turnover ratio = cost of goods sold/average inventory value
A good inventory turnover rate varies by industry, company, and item. Slow-moving items will have a turnover of between 2 and 4, while fast-moving, high-margin items might see a turnover of 10 or more.
Higher turnover generally means greater efficiency in holding sufficient stock and avoiding excess levels that increase costs.
The inventory turnover ratio formula is:
Inventory turnover ratio = cost of goods sold/average inventory value
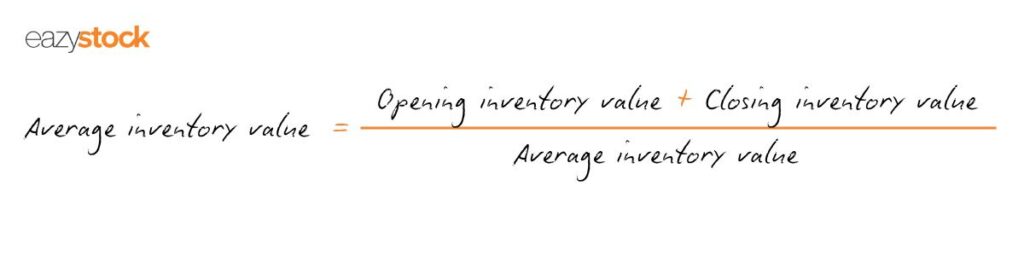
Average inventory value = (Opening inventory value + Closing inventory value)/2
You can identify slow-moving or obsolete stock by its low inventory turnover rate over 6-12 months. Slow-moving stock will have a turnover rate of 2-4. Obsolete stock will be 0 or 1 to indicate no demand for the item.
Inventory turnover measures how quickly stock is sold and replaced during a set period, while the sell-through rate compares the total inventory sold with the total inventory received from a supplier.
Rather than focusing on how quickly stock turns over, the sell-through rate helps you assess your supply chain efficiency by reviewing demand-forecasting accuracy, highlighting popular products, and mitigating storage costs.
Sell-through rate = (units sold/units received) x 100
Inventory carrying costs are calculated by totalling all inventory-related overheads and dividing them by the average annual inventory value. Holding costs are usually expressed as percentages, with values typically ranging from 15% to 20%.
Inventory overheads include capital costs (related to investment in stock), storage space costs (warehouse, mortgage, maintenance), inventory service costs (insurance, security, hardware, physical costs), and inventory risk costs (insurance to cover shrinkage, wastage, obsolescence).
The perfect order rate is the percentage of orders that are delivered on time, in full, without damage, and with accurate documentation. It measures operational efficiency and customer satisfaction.
The perfect order rate (POR) formula is (total orders – failed orders)/total orders x 100.
A POR (Perfect Order Rate) of 95% or higher reduces costs, prevents returns, and increases customer loyalty.
High stockout rates indicate inefficient and inaccurate forecasting methods leading to regular stockouts. If customers cannot access the items they need when they need them, they will find alternative suppliers. If they move to another supplier, they won’t just go for that one item; they will take their entire basket there. If they get good service and don’t experience stockouts, it’s likely that supplier will retain the customer’s business.