Improving demand forecasting accuracy

The importance of demand forecasting accuracy
In supply chain management it’s important to be able to measure the accuracy of your demand forecasts. Inaccurate demand forecasting can lead to the accumulation of excess stock or, the reverse – issues with product availability. Both are unwelcome problems for inventory planners!
Improving forecasting accuracy should be a key objective for any inventory planning team. In short, accurate demand forecasting helps you:
- Improve customer satisfaction
Customers have zero tolerance for out-of-stock scenarios. Ensuring stock availability keeps positive reviews flowing. - Optimise inventory levels
Setting safety stock levels based on accurate forecasts will prevent stock-outs without holding excess stock. - Manage supplier lead times
By giving suppliers a forecast of your annual inventory needs, they can plan to meet your delivery deadlines. - Prevent lost revenue
Out-of-stock scenarios lead to lost sales, not only for that product but for companion items too.
How do you improve demand forecasting accuracy?
You can calculate the accuracy of your inventory demand forecasts by comparing the original forecast with the actual demand for those items. If you find your forecasting accuracy is poor, you can consider the following actions to improve it:
- Introducing demand forecasting techniques that account for variables, such as seasonality or trends, to layer on top of your base demand.
- Swapping manual spreadsheets for a demand forecasting tool that automatically generates your forecasts, so you can spend more time reviewing them (instead of calculating them).
- Reviewing external market factors, for example, if your business trades in an industry where demand is erratic, you will find producing accurate forecasts much more challenging than when you’re dealing with stable marketplaces.
- Managing stock items at different stages of their product life cycle with different forecasting models. For example, you’ll need to treat new products (with unknown demand) differently from those that are mature and have steady demand and differently from those in decline that may need special attention as demand becomes intermittent.
- Preventing forecast bias that can cause over or under-ordering by ensuring forecasts are based on historical demand data.
- Recognising and acting on the bullwhip effect. This is when a small fluctuation in demand at the top of the supply chain increases as you move further down. For example, each planner orders a ‘little extra’ stock and inflates their forecasts to cover the risk of run-out.
Improve forecasting accuracy by identifying demand outliers
Forecasting accuracy can also be affected by ‘outliers’ or ‘fliers’ in the data. An outlier is a data point that is not considered to be part of the overall pattern of demand for an item. It is less predictable and usually a one-time event. Unusual demand can be caused by known events, e.g., a large, one-time order or a flash clearance sale. Or it can be caused by events that you have no knowledge of, e.g., a customer going out of business, natural disasters, etc.
A demand outlier can either be overly high or overly low compared to other data points in the data series.
Since fliers can affect and skew the accuracy of demand forecasting data, it can be useful to discard them from your overall forecasting calculations. However, this isn’t always the case, and on closer inspection, some outliers may turn out to be genuine demand patterns. Therefore, they often need to be examined to see if their usual behaviour can be explained.
It’s critical to flag and monitor demand outliers to prevent the distortion of your inventory forecasts over time. By identifying outliers, you can improve forecasting accuracy and prevent over- or under-stocking, ultimately reducing the risk of either tying up capital in excess inventory or experiencing out-of-stock situations.
Identifying demand outliers
There are several ways to detect demand outliers, from the very simple to the very complex.
A basic method is to visualise the data and spot the fliers. A more complex option is to use statistical calculations. In this case, an outlier is usually determined by the number of standard deviations away from the mean.
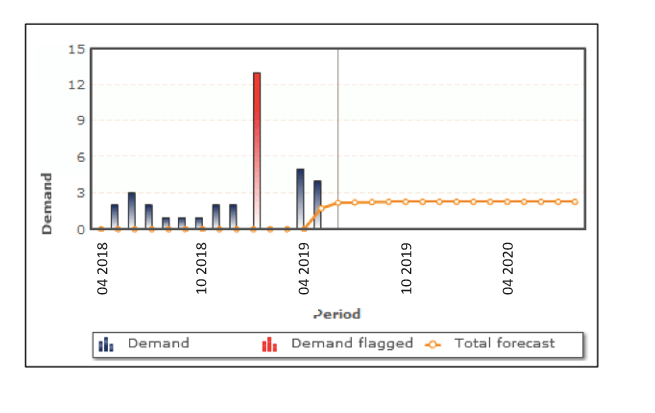
In the example above, you can see historical data for a 12-month demand period and then the forecast looking forward.
The red bar has been highlighted as a potential flier, due to its obvious standard deviation away from the normal average demand.
As an inventory planner, you have the option to remove this outlier from your future demand forecast and base your forecast on the blue bars. In the example above, the orange line reflects this decision.
You could also choose to ignore this outlier in your data if you believe this demand pattern to be ‘normal’. For example, you may look back over data from previous years and see the same pattern occur annually. In this case, you would include the outlier in your forecast.
Using automation to improve demand forecasting accuracy
Regularly reviewing every item in your warehouse to calculate forecast error, spot outliers and understand the causal factors can be a time-consuming job. However, it’s possible to use software to do this for you. Demand forecasting software, such as EazyStock, will automatically generate demand forecasts and then go back and check their accuracy – on a daily basis! It can also flag fliers in your demand data to ensure they do not accidentally influence your forecasts and alter your forecasting accuracy.
If you have an Enterprise Resource Planning (ERP) system or a Warehouse Management System (WMS) investigate whether this functionality is available to you.
With a proper system in place to track and flag demand fluctuations, you can remove the risk of negatively impacting your demand forecasting accuracy.
Need help improving forecasting accuracy?
If you find it challenging to forecast demand accurately, it may be time to consider demand forecasting software, such as EazyStock. EazyStock will simply plug into your ERP or business system and provide an added level of inventory management functionality.
Contact EazyStock to schedule a demo and discover how easy it is to use dynamic demand forecasting methods to increase inventory performance and profitability.
First published on 08 January 2018, updated June 2021.