How to Improve Forecast Accuracy: Manage Demand Outliers

What is forecasting accuracy?
Forecasting accuracy is the process of calculating the accuracy of your inventory demand forecasts by comparing the original forecast with the actual demand for those items.
Forecasting accuracy can be affected by ‘outliers’ or ‘fliers’ in the data. An outlier is a data point that is not considered to be part of the overall pattern of demand for a product. For example, sales transactions that result from a flash clearance sale do not represent typical demand for a given period.
A demand outlier can either be overly high or overly low compared to other data points in the data series.
Whereas some fluctuations in demand, like seasonality, can be tracked in patterns over time, fliers are less predictable and are one-time events. Unusual demand can be caused by known evens such as large one-time orders or sales promotions. Or they can be caused by events which you have no knowledge of such as a customer going out of business, natural disasters, etc.
Since fliers can affect and skew the accuracy of demand forecasting data, it can be useful to discard them from your overall forecasting calculations. However, this isn’t always the case, and on closer inspection some outliers may turn out to be a genuine demand pattern. Therefore, they often need examining to see if their usual behavior can be explained.
Improve forecasting accuracy by identifying demand outliers
It’s critical to flag and monitor outliers in your demand patterns to prevent the distortion of your inventory forecasts over time. By identifying outliers and improving forecasting accuracy, you can prevent over- or under-stocking and reduce the risk of either tying up capital in excess inventory or experiencing stock-outs.
Identifying demand outliers
There are a number of ways to detect demand outliers – from the very simple to the very complex.
A basic method is to visualize the data and spot the fliers visually. A more complex option is to use statistical calculations. In this case an outlier is usually determined by the number of standard deviation away from the mean.
Deciding how to handle outliers
In this example, you can see historical data for a 12-month demand period and then the forecast looking forward:
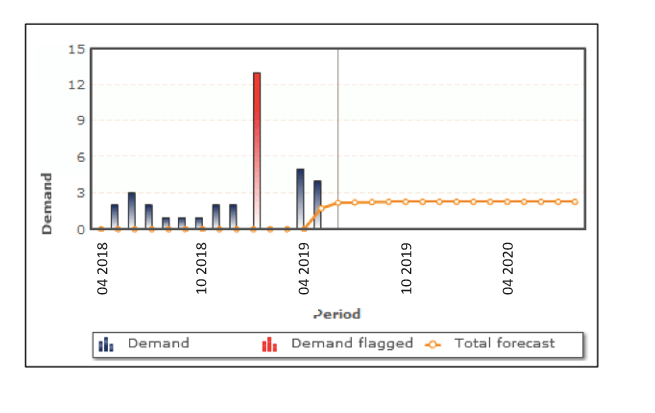
The red bar has been highlighted as a potential flier due to its obvious standard deviation away from the normal average demand.
As an inventory planner, you have the option to remove this outlier from your future demand forecast and base your forecast on the blue bars. In the example above, the orange line going forward reflects this decision.
Or you could choose to include this outlier in your data, if you believe this demand pattern to be ‘normal’. For example, you may look back over data from previous years and see the same pattern occur annually. In this case you would include the outlier in your forecast.
Automating demand outlier alerts
Regularly reviewing every SKU in your warehouse to spot outliers can be a time-consuming job. However, it’s possible to use software to carry out the analysis for you. Inventory optimization software such as EazyStock will automatically flag demand fliers in your data sets to ensure they do not accidentally influence your forecasts and alter your forecasting accuracy. You can set up the tool so that it either allows you to review the flier alerts and make an informed decision about whether to include or ignore the outlier in the future forecast, or you can simply let the system make the decision automatically for you.
If you have an Enterprise Resource Planning (ERP) system or a Warehouse Management System (WMS), investigate whether this functionality is already included. With a proper system in place to track and flag unusually high or low inventory demand outliers, you can remove the risk of negatively impacting your demand forecasting accuracy.
Need help improving demand forecasting accuracy?
 If you find it a challenge to accurately forecast demand, it may be time to consider demand forecasting software like EazyStock. EazyStock will simply plug into your ERP or business system and provide an added level of inventory management functionality.
Wondering what other ways you can manage improve your demand forecasting? Take a look at our guide to better forecasting!