
An introduction to Days Inventory Outstanding (DIO)

Days Inventory Outstanding (often shortened to DIO) is one of the simplest ways to answer a practical question: “How many days worth of stock do we typically hold?” If you work in inventory planning, warehousing, procurement, or supply chain, DIO helps you connect day-to-day stock decisions to cash, service levels, and risk, such as obsolescence.

By the end of this blog, you’ll understand what days inventory outstanding means, the formula for calculating it, and some common variations. We provide a step-by-step guide to calculating inventory days, explain how to avoid common mistakes, and provide practical ways to improve DIO without hurting availability.
Days Inventory Outstanding definition
Days inventory outstanding estimates how many days inventory sits in your business before it is sold or used. Think of it as your typical days of stock on hand.
Generally, a higher DIO means you’re holding more stock for longer, which ties up cash and increases the risk of damage, expiration, spoilage or obsolescence.
A lower DIO means you’re turning over inventory faster, tying up less cash and improving cash flow. However, if it’s too low, you’re at risk of stockouts or missed sales. The ‘right’ value depends on your industry, product lifecycle, supply lead times, and service targets.
Inventory days calculation: step by step
To calculate your days inventory outstanding, you will need to gather some information before applying the formula.
- Select the period you want to cover and note the number of days in it (e.g., 30 for a month, 90 for a quarter, 365 for a year).
- Find your opening and closing inventory at cost for that period from your ERP, inventory valuation report, finance close pack or inventory spreadsheet.
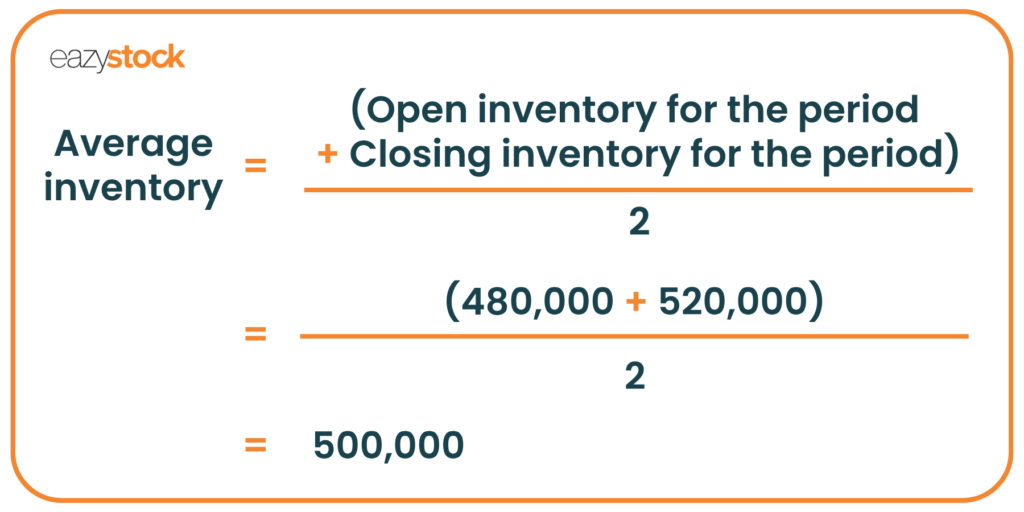
- Calculate your average inventory using the formula (Opening inventory for the period + Closing inventory for the period) ÷ 2.
- Calculate COGS for the same period, which is the cost of items sold or used during that period (remember to use cost, not sales revenue). If you’re analysing manufacturing usage, use “cost of issues/consumption”.
The Days Inventory Outstanding formula (DIO formula)
Once you have the fundamental data, you can calculate DIO. The most common formula for calculating days inventory outstanding is:
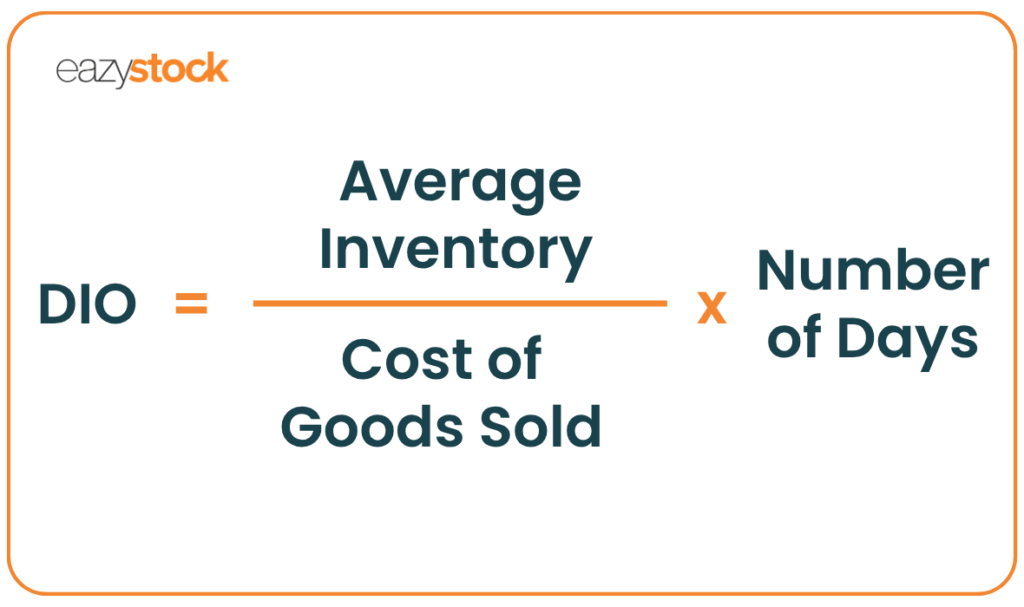
This is the same as when people refer to inventory stock days, days of stock, or a stock days formula. While the label changes, the logic is the same: you compare the inventory value to the rate at which you consume or sell it, then convert that ratio into days.
Once you have calculated DIO, double-check the result against operational realities (capacity, lead times, seasonal build, and known slow movers).
Worked examples (with the stock days formula)
It’s easier to understand how to calculate days inventory outstanding by running through some examples.
Example A: steady month
Let’s say you’re calculating inventory days for a 30-day month.
- Opening inventory (at cost) = 480,000
- Closing inventory (at cost) = 520,000
- COGS for the month = 600,000
- Number of days: 30
Step 1: Find your average inventory
Step 2: Calculate your DIO
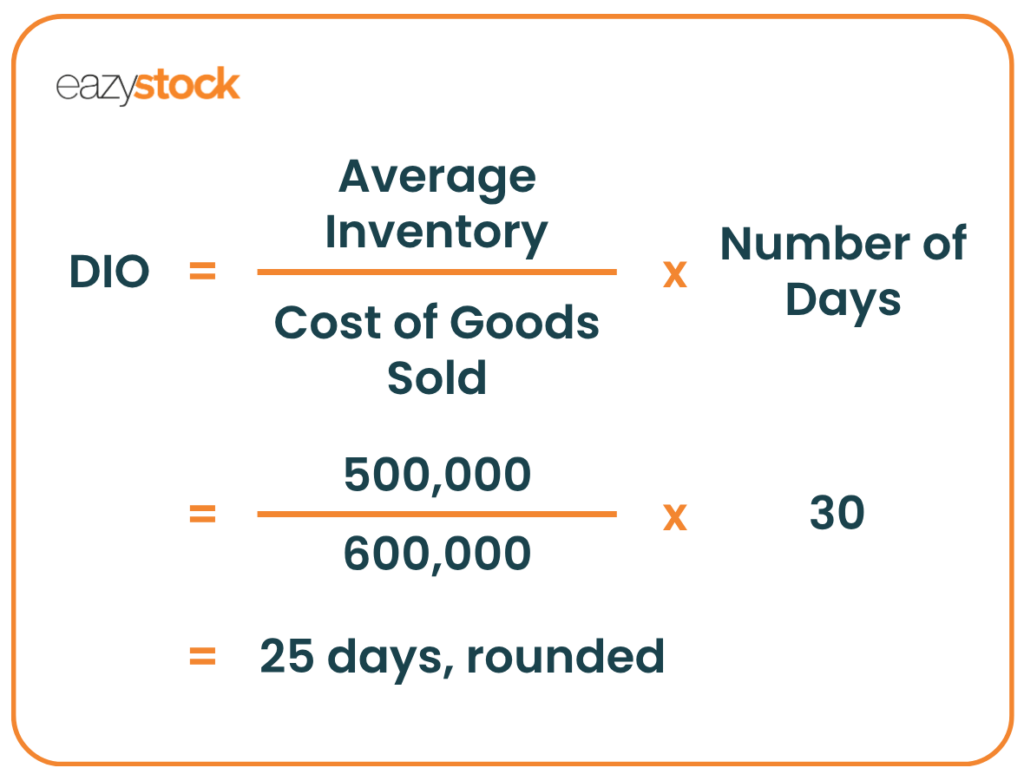
What this means: You’re carrying about 25 days’ worth of stock based on that month’s consumption or sales rate.
Example B: seasonal build (why averages matter)
Assume you have items with seasonal demand profiles and you’re building inventory ahead of a peak season. You’re still looking at a 90-day quarter, but inventory rises throughout the period.
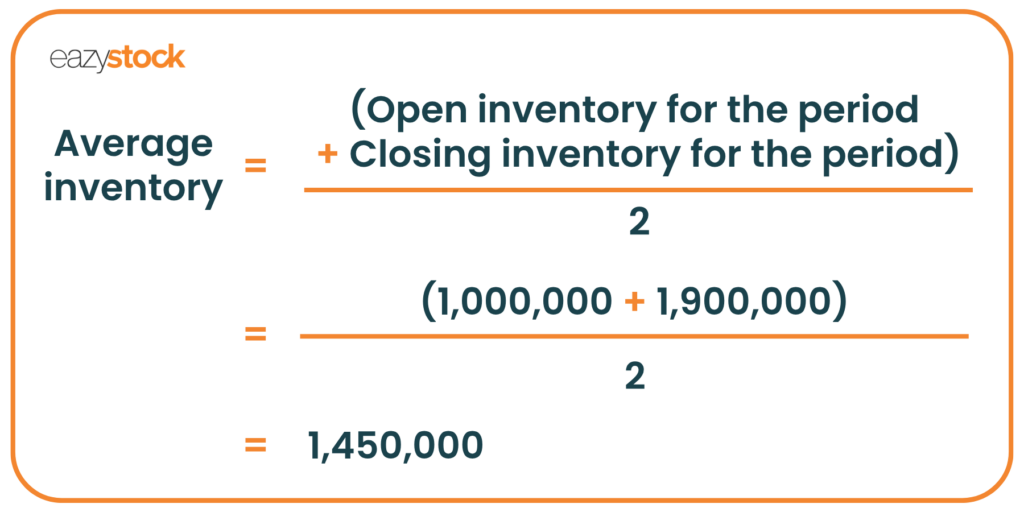
- Opening inventory (at cost) = 1,000,000
- Closing inventory (at cost) = 1,900,000
- COGS for the quarter = 2,700,000
- Number of days = 90
Step 1: Find your average inventory
Step 2: Calculate your DIO
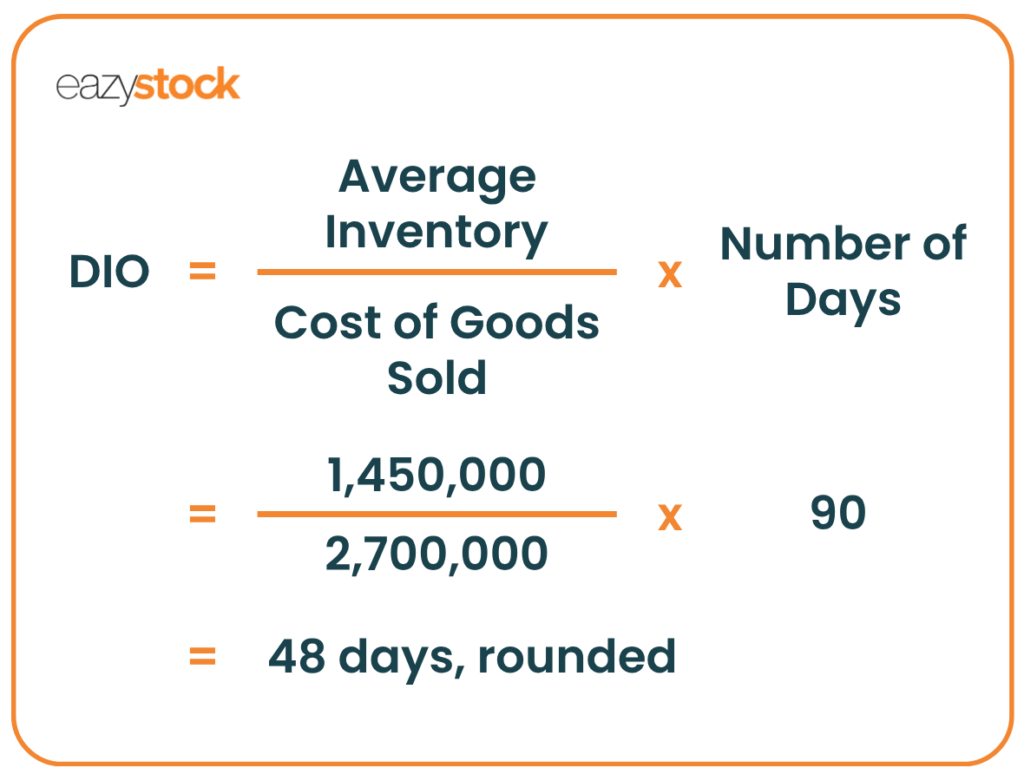
What this means: You carried roughly 48 days’ worth of stock during the quarter. If your inventory fluctuates significantly due to seasonality, large inbound deliveries or promotions, using a monthly or weekly average can provide more accurate figures.
How to interpret DIO
There isn’t a universal “good” DIO. For example, a grocery chain expects low inventory days because products move quickly and have expiration dates. However, a manufacturer of complex equipment may expect higher inventory days due to long lead times, minimum order quantities, and work-in-progress. Here are some ways to measure progress and benchmark your results.
- Compare to yourself first: track DIO month-over-month and year-over-year.
- Compare like with like: similar product families, similar channels, similar supply models.
- Use DIO with service KPIs: a lower DIO is only a win if on-time delivery and fill rate stay healthy.
- Segment your view: overall, DIO can hide slow movers; look at DIO by ABC class, category, or site.
Common mistakes in inventory days calculation
Although the DIO formula is a simple calculation, common mistakes can leave it unreliable.
- Using sales revenue instead of COGS: DIO is a cost-based metric, so sales prices will distort it.
- Mixing time periods: ensure inventory (opening/closing) and COGS are from the same period.
- Using ending inventory only: if inventory rises or falls over the period, ending inventory can overstate or understate the true days of stock.
- Ignoring write-offs and obsolescence: if slow-moving stock isn’t addressed, DIO can look stable while risk grows.
- Not separating WIP from finished goods: for manufacturing, it could be better to consider whether you want a DIO view by inventory type.

How to improve days inventory outstanding without impacting service levels
Improving DIO usually means reducing the inventory required to meet the same level of demand or increasing throughput without increasing inventory levels. Here are some practical methods commonly used by inventory teams:
- Improve forecasting inputs: correct master data to ensure lead times and order multiples are up to date, refresh demand history rules, and align replenishment with promotions and events.
- Segment policies: carry out ABC analysis and set different reorder points or safety stock rules for A vs C items to avoid an accumulation of slow-moving items.
- Reduce lead time and variability: where possible, work with suppliers to identify opportunities to shorten cycles, increase delivery frequency, or develop more reliable schedules.
- Review minimum order quantities (MOQs): large MOQs often lead to excess stock days. Work with suppliers to negotiate or redesign pack sizes where possible, or find alternative suppliers who can better meet your needs.
- Control new-item introductions and end-of-life plans: plan ramp-up and ramp-down so you don’t build obsolete stock.
- Strengthen “slow and excess” routines: initiate regular reviews, redeploy or transfer stock, substitute parts, discount or clear items, or return to suppliers to prevent slow and excess stock from becoming obsolete costs.
- Fix the root causes of buffers: if teams add “just-in-case” stock because of quality issues, late suppliers, or unstable production, address these issues. Calculate safety stock accurately for each item and avoid using a blanket level.
Summary
- Days inventory outstanding meaning: an estimate of how many days of stock you hold based on inventory value and the rate you sell or use it.
- DIO formula or formula days inventory outstanding = (Average Inventory ÷ COGS) × Number of Days.
- Stock days formula or inventory stock days arecommon alternate ways to say the same concept.
- How to use DIO effectively: track trends, segment by category, and interpret results alongside service KPIs.
If you’re new to DIO, start with last month’s and last quarter’s calculations, then break them down by product family or ABC class. This will highlight where ‘healthy’ stock supports service and where extra days’ inventory outstanding are quietly tying up cash.
Days inventory outstanding FAQs
The most common formula for calculating days inventory outstanding is:
DIO = (Average Inventory ÷ Cost of Goods Sold) × Number of Days
This is the same as when people refer to inventory stock days, days of stock, or a stock days formula. While the label changes, the logic is the same: you compare the inventory value to the rate at which you consume or sell it, then convert that ratio into days.
A high DIO indicates that you are holding onto inventory for too long before it sells. This can result from an inefficient sales process, overstocking due to inaccurate demand forecasts, and a lack of visibility into inventory data. This can lead to increased storage costs and tie up capital that could be invested elsewhere in the business.
A low DIO can be beneficial, but if it’s too low, it could lead to stockouts during a sudden spike in demand.
A good DIO varies by industry, product lifecycle, supply lead times, and service targets. Fast-moving retail goods, particularly those with expiry dates, will have lower DIOs, whereas manufacturers and distributors will have higher inventory days due to long lead times, minimum order quantities, and work in progress.
To reduce your DIO, improve the accuracy of your demand forecasts to avoid excess stock, liquidate slow-moving or obsolete items, and improve supply chain efficiency to shorten lead times. Work with your suppliers to ensure MOQs and order terms meet your business needs.
DIO and inventory turnover are opposites, so a low DIO usually means a high inventory turnover. Conversely, a high DIO means a low inventory turnover. While DIO is expressed in days, inventory turnover is expressed as a frequency.
How frequently you monitor DIO will depend on your industry and product demand profiles. You should monitor DIOs regularly to identify trends and measure inventory management efficiency.
Book a demo.