
An explanation of ABC XYZ inventory analysis and why it adds value

In previous posts, we’ve discussed the benefits of ABC classification models and how to use them to improve inventory control and management. ABC analysis can be a simple and effective way for inventory planning teams to prioritise workloads and save time spent managing inventory. However, it’s oversimplistic evaluation criteria have limitations.
As ABC classification prioritises items based only on value, it neglects other crucial inventory management factors, such as forecastability. Forecastability is the likelihood that demand and forecast will vary, i.e., how reliable your forecasts are. These factors will influence your inventory levels and where you focus your time.
Introducing ABC XYZ analysis or ABC XYZ classification can help overcome this issue, as it helps classify products based on their demand variability.
What are XYZ items?
- X items – X items have regular demand, making them easier to forecast. Low demand variation and reliable forecasts mean they should be ordered the most frequently.
- Y items – Y items don’t have steady demand, making them harder to forecast. Influential factors like seasonality, product lifecycles, competitors, or the economy bring substantial demand variability. This means items should be ordered less frequently depending on their demand variations.
- Z items – Z items have very irregular difficult-to-predict demand. Getting accurate demand forecasts is almost impossible without trends or predictable influential factors. The demand volatility of Z items means they should be ordered the least often.
- Out blog post on how to forecast intermittent or lumpy demand discusses this in more detail.
Incorporating ABC XYZ classifications in inventory management processes will help set optimal order schedules and service levels.
For example, companies can invest in X items, knowing they will sell. They can also reduce investment in Y and Z items to avoid overstocking and potential dead stock.

How to calculate ABC XYZ inventory analysis
Inventory policies determine which items will be stocked and which will be non-stocked. Using ABC XYZ analysis enables you to build an inventory policy matrix so you can:
- Focus on your most important items.
- Identify optimal inventory levels.
- Highlight high-risk items.
- Improve efficiency.
To calculate forecastability or demand variability for an item, you need to:
- Find its average demand during a given period. Setting an appropriate period for assessing demand volatility is essential to get the most accurate information and account for variations.
- For example, if you have items with seasonal demand, it makes sense to include 12 months of data to cover the seasonal peaks and troughs.
- Find the difference between the demand at each data point and the average.
- Calculate the square root of each difference and find the average.
- The demand variability is the square root of the average.
In statistical terms, demand variability can be expressed as the coefficient of variation.
To categorise your products into X, Y and Z:
- Identify the items you want to include in the analysis.
- Calculate the coefficient of variation for each item
- (standard deviation / mean) * 100.
- Sort the items by increasing coefficient of variation and accumulate the figures.
- Set the boundaries for each category. For example, safety stock levels, minimum reorder points and target service levels.
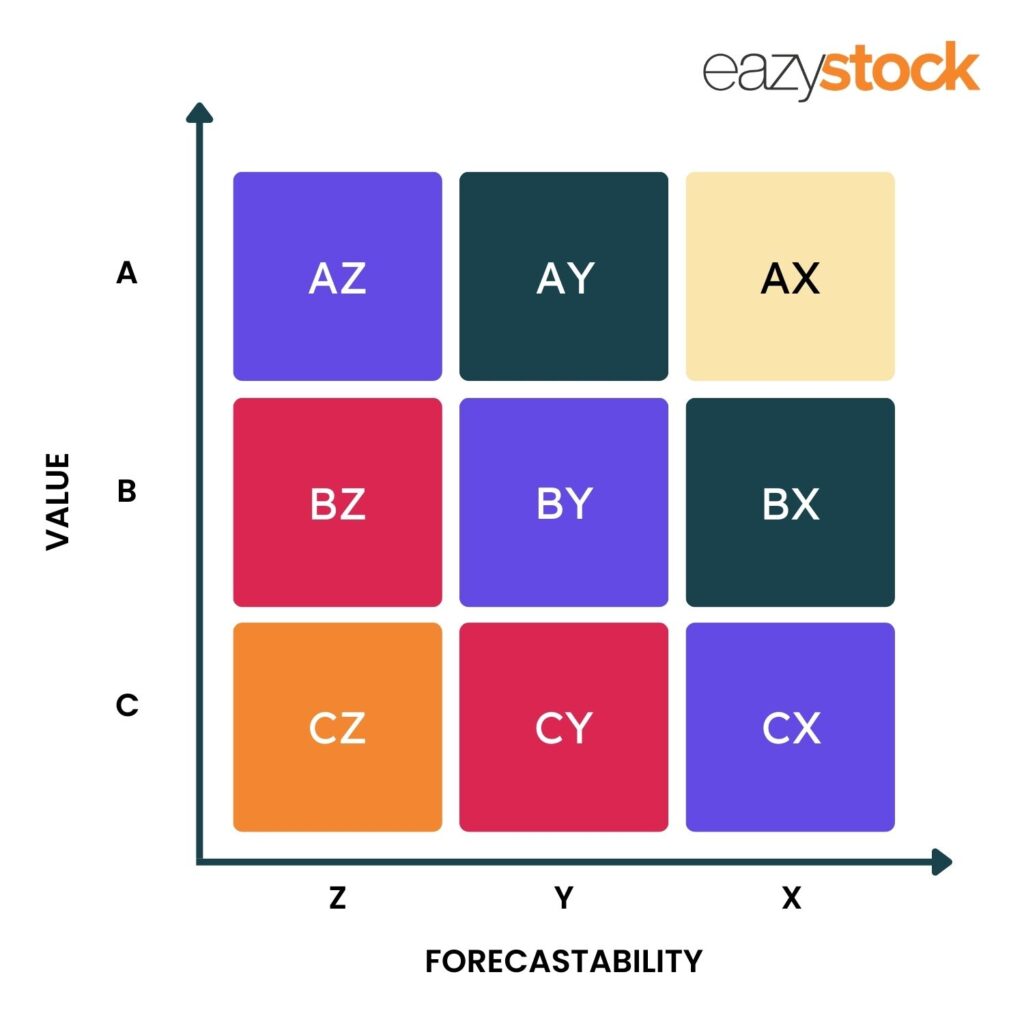
With your ABC and XYZ categories identified, you can produce a matrix like the one below and assign each group.
Adding another level of insight to your inventory classification process allows you to make more informed ordering and stocking decisions. For example, treating valuable AX items with constant demand differently from AZ items with erratic demand makes sense. Where demand is steady and easy to predict (X items), you can have lower safety stock levels than for products with more volatile demand (Z items).
From ABC XYZ analysis to automation
XYZ analysis offers a more sophisticated inventory categorisation framework. However, time-consuming, manual calculations and spreadsheets make it harder to keep your calculations up to date as sales volumes vary and products move between categories.
An inventory optimisation tool like EazyStock can automate the process to make it less daunting. EazyStock takes ABC XYZ analysis to the next level by categorising your inventory based on multi-dimensional criteria such as demand, sales frequency, number of picks and annual consumption value. The system automatically analyses and re-classifies your inventory daily, so products are always managed according to the most relevant inventory policy.
For more information on EazyStock or to book a demo click here.
Alternatively, try our new free abc classification tool. Simply drop your data in to get instant ABC classifications and exportable results.

FAQs about ABC XYZ inventory analysis
ABC and XYZ are part of the same classification analysis; XYZ adds extra elements. ABC classification is one-dimensional and can be oversimplistic, as it prioritizes items based solely on their value. This influences the inventory you carry and focuses your time. XYZ analysis helps classify products based on their demand variability.
- X-items have regular demand with reliable demand forecasts
- Y-items don’t have steady demand, leading to substantial demand variability
- Z-items have very irregular demand that is difficult to predict.
ABC XYZ analysis informs inventory management processes to set optimal order schedules and service levels.
First, calculate your ABC analysis (annual consumption value), then calculate demand variability:
- Identify the items you want to include in the analysis
- Calculate the coefficient of variation for each item, e.g., (standard deviation/mean) x 100
- Sort the items by increasing coefficient of variation and accumulate the figures
- Set the boundaries for each category
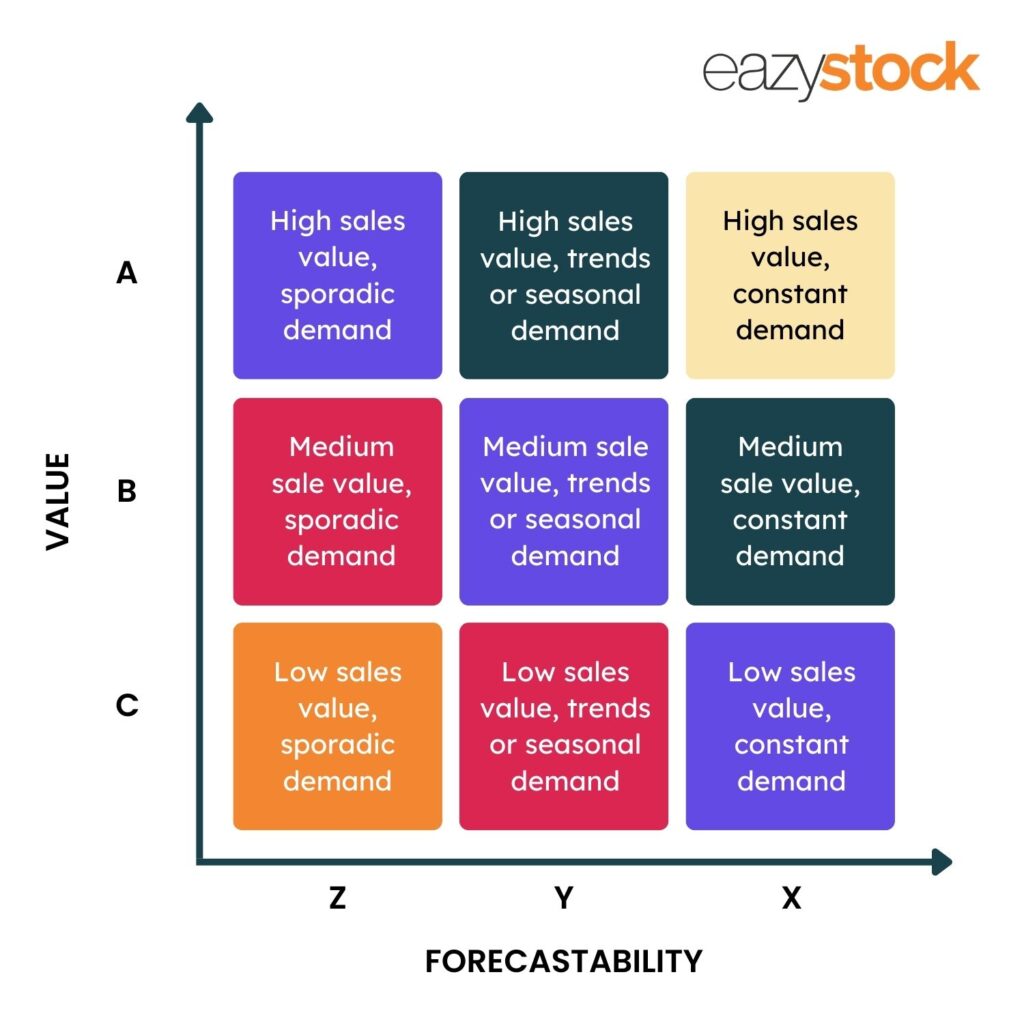
Create a 3×3 matrix with forecastability along the X-axis and value along the Y-axis.
- AZ – High sales value, sporadic demand – Top priority
- AY – High sales value, trends or seasonal demand – High priority
- AX – High sales value, constant demand – High risk/value
- BZ – Medium sales value, sporadic demand – Moderate
- BY – Medium sales value, trends or seasonal demand – Moderate
- BX – Medium sales value, constant demand – Moderate
- CZ – Low sales value, sporadic demand – Low cost
- CY – Low sales value, trends or seasonal demand – Low cost
- CX – Low sales value, constant demand – Low cost
XYZ analysis measures volatility by classifying inventory items based on their demand consistency over time, using the standard deviation divided by the mean. It classifies items into:
- X (stable/low priority),
- Y (fluctuating/moderate priority),
- Z (irregular/high priority).
ABC XYZ analysis should be carried out quarterly to ensure changes are picked up and acted on. Although the analysis should be redone when there are changes in demand, supplier prices, or supply. It’s also important to conduct more regular reviews of high-turnover or volatile items, or those with seasonal demand.
As manual reviews can be time-consuming, automated systems allow for continuous reclassification, allowing you to focus on actions instead.
AX items have high sales value and constant demand, making them the most important to the business. The best inventory strategy is to monitor these tightly and use automation to maximize availability while minimizing inventory investment.
CZ items are considered the most difficult to manage because they exhibit the most demand variability, making it extremely difficult to provide accurate forecasts, particularly when using manual forecasting methods. Inventory optimisation software uses advanced algorithms to improve forecasting accuracy of CZ items to ensure balanced stock levels.
Inaccurate forecasts increase the risk of imbalanced inventory levels, dead stock and stockouts. Excess stock leads to higher carrying costs and wasted capital, while stockouts lead to poor customer service and the risk of customers finding alternative suppliers.
ABC XYZ analysis provides more insight into inventory to facilitate data-driven ordering and stocking decisions. Using ABC XYZ analysis to inform stocking policies enables tailoring those policies to each item group. Instead of holding safety stock for all items, you can match safety stock levels to ABC XYZ profiles. For example, AX items require lower buffers than Z items, which have erratic, volatile demand.
With a better understanding of demand variability from XYZ analysis, companies can better anticipate needs and reduce unnecessary safety stock for items with unpredictable demand.
Optimizing resource allocation allows inventory management teams to focus efforts on high-impact items (AX, AY), reducing safety stock levels for less critical, slow-moving items.
- X items with constant, stable demand need low safety stock levels
- Y items with fluctuating demand need moderate safety stock levels
- Z items with irregular or erratic demand need high safety stock levels.