Inventory KPI Dashboard
Get visibility of the KPIs that drive availability, cash flow and customer satisfaction. EazyStock shows you exactly how your stock is performing so you can act fast and improve results.
Get visibility of the KPIs that drive availability, cash flow and customer satisfaction. EazyStock shows you exactly how your stock is performing so you can act fast and improve results.
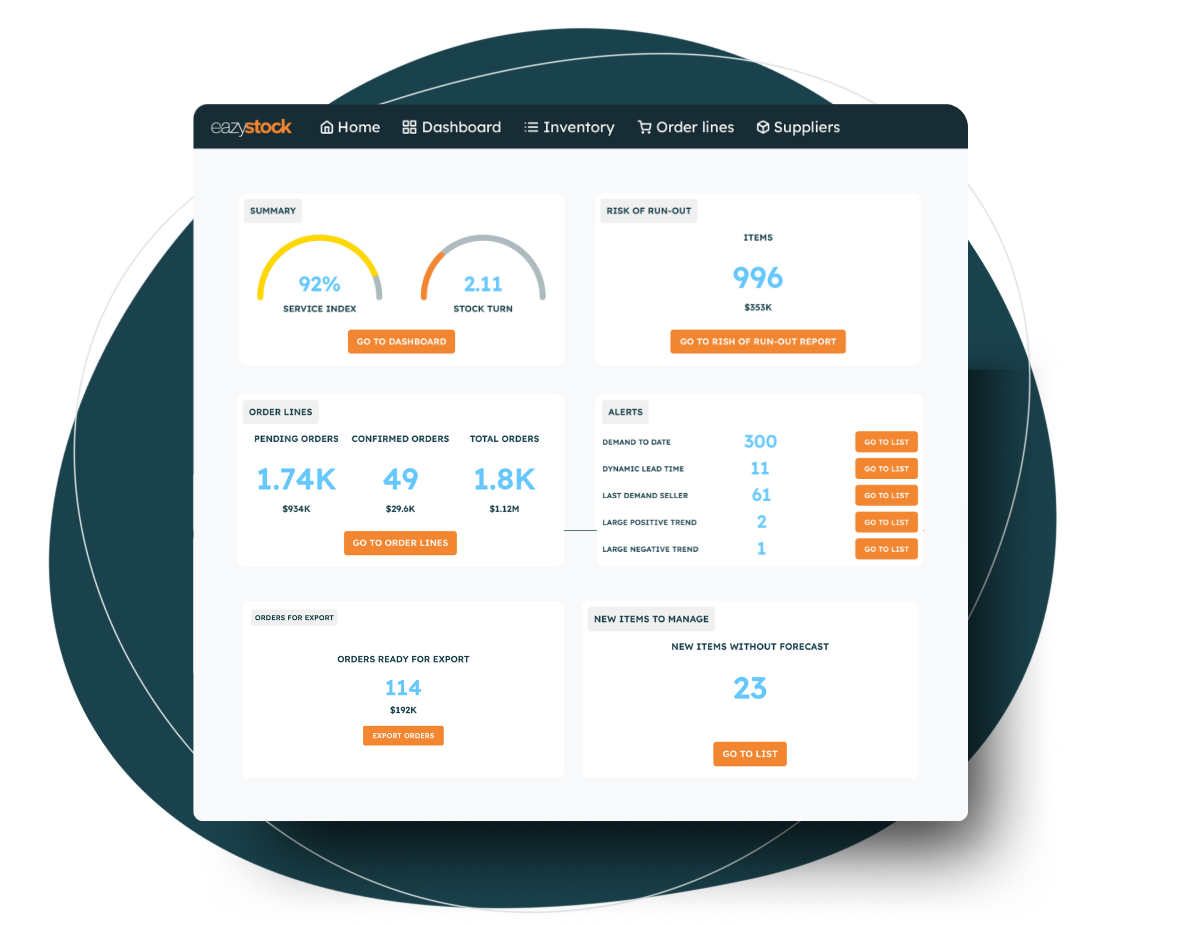
Start with a clear single view of your stock performance across all locations. The summary screen highlights risks and opportunities immediately, and you can explore the detail or share quick snapshots with your team whenever you need to.
EazyStock’s KPI dashboard updates daily so you can see where stock performance is off track. Open detailed reports to uncover the cause and take quick action to improve availability and reduce excess.
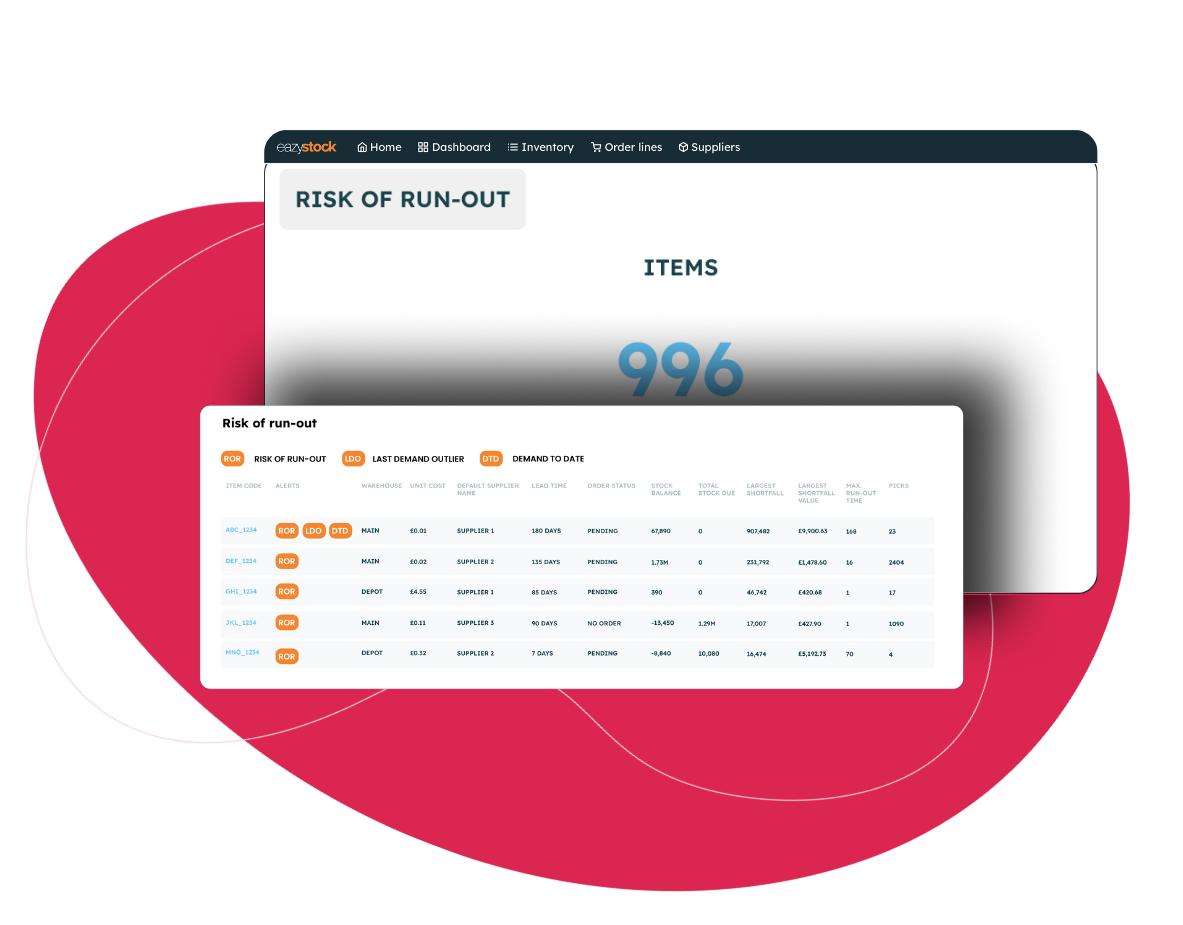
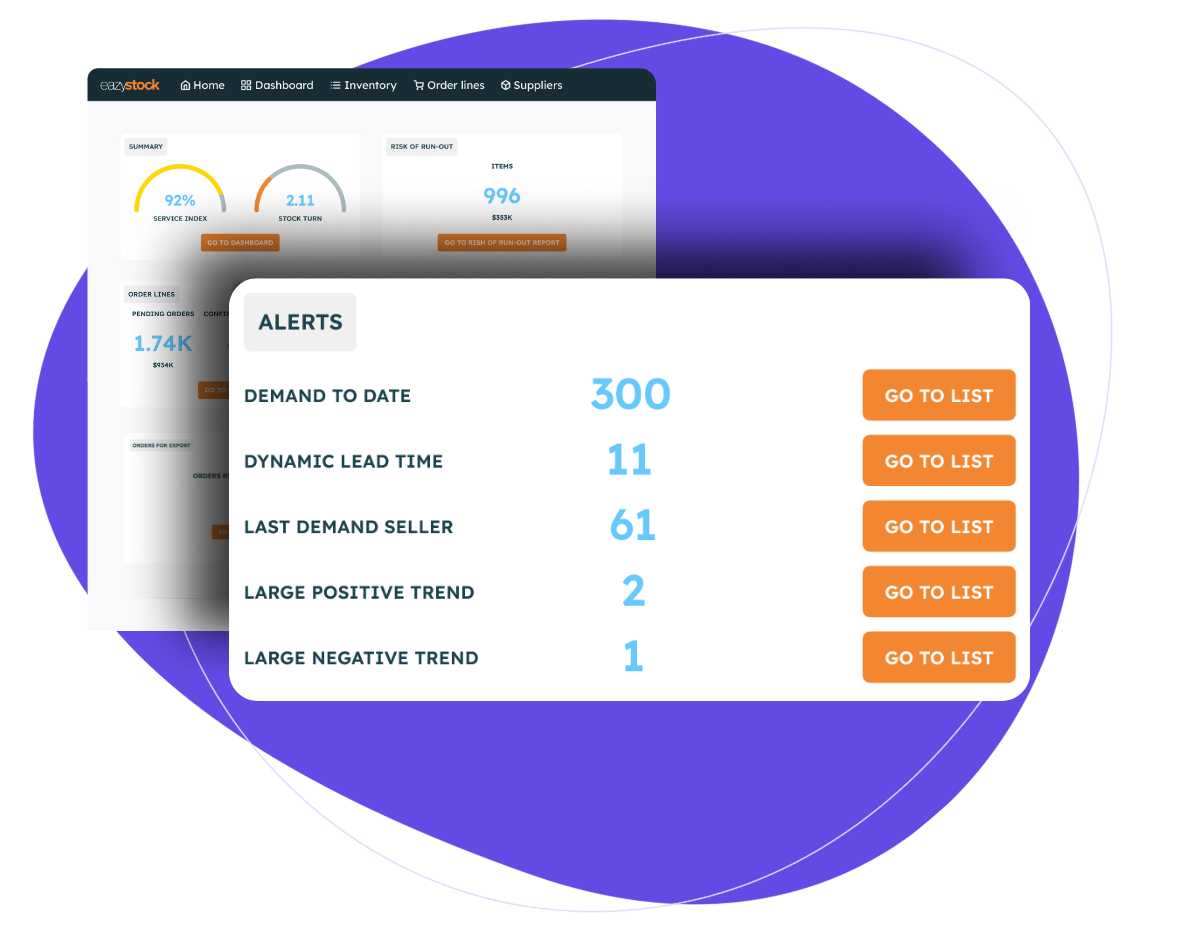
EazyStock flags items at risk of stockouts, demand shifts or excess build-up so you can act before there’s a problem. Spend less time digging through reports and more time making the inventory decisions that matter.
EazyStock automatically tracks your inventory KPIs and updates them every day. Get the insights you need to reduce excess, avoid stockouts, and make smarter inventory decisions without the manual work.
Find answers to the most common questions about inventory KPIs and how EazyStock helps you measure and improve stock performance.
An inventory KPI dashboard shows your key stock and supply chain metrics in one place. It helps you monitor performance, spot risks, and make informed inventory decisions based on daily updates.
The most useful KPIs are those that show how well you’re balancing stock levels and meeting demand. Common examples include service level, stock turn, stock value, sales value, and order fulfilment rate.
Inventory KPIs help you avoid stockouts, reduce excess stock, and improve cash flow. Tracking them regularly ensures you have the right products available while minimising capital tied up in inventory.
EazyStock updates your KPI dashboard every day. This gives you up-to-date insight without the complexity of real-time integrations, keeping calculations accurate and easy to manage.
Yes. EazyStock can monitor inventory KPIs across multiple sites or warehouses, giving you a complete view of stock performance across your entire business.
Yes. The dashboard is fully customisable so you can focus on the KPIs that matter most to your business. You can also drill into item-level data for detailed analysis.
EazyStock uses your historical demand, stock levels, lead times, and other inventory data to calculate achieved and projected service levels. Its machine-learning algorithms generate accurate demand forecasts to optimise reorder points and stock levels.
Yes. By monitoring stock value, stock turn, and service levels together, EazyStock highlights slow-moving or overstocked items so you can reduce excess and free up working capital.
EazyStock is cloud-based and designed to connect quickly with minimal IT input.
Yes. You can export KPI data, share summary screens, and drill into item-level details. This makes it easy to report on inventory health and performance trends across the business.
Visit your local website for products and services specific to your country.