How to calculate ABC analysis – a working example

What is ABC analysis/ABC classification?
Inventory management teams use ABC classification (also called ABC analysis) to help identify the most important stock items in their portfolio and ensure they focus on managing them above those less valuable. Using ABC classification, inventory is divided into three categories:
Category A: this is the smallest category and consists of the most important stock items
Category B: will generally be slightly larger in terms of volumes of SKUs and will usually be made up of products of less value
Category C: this will typically be the largest category where products will contribute the least to your business’s bottom line
An ABC inventory classification system, or ABC analysis, is based on the theory that all inventory is not of equal value. Instead, it follows the Pareto Principle (the 80/20 rule), where 20% of stock accounts for 80% of the value to the business.
This post uses a working ABC analysis example to demonstrate how to classify your inventory. We’ll also show you how to take things one step further by introducing the concept of XYZ analysis. Read our post ‘The importance of ABC analysis in inventory management‘ for a broader overview of ABC inventory analysis.
ABC analysis example
Here is a working ABC analysis example, showing how to divide your inventory using annual consumption value (or usage value).
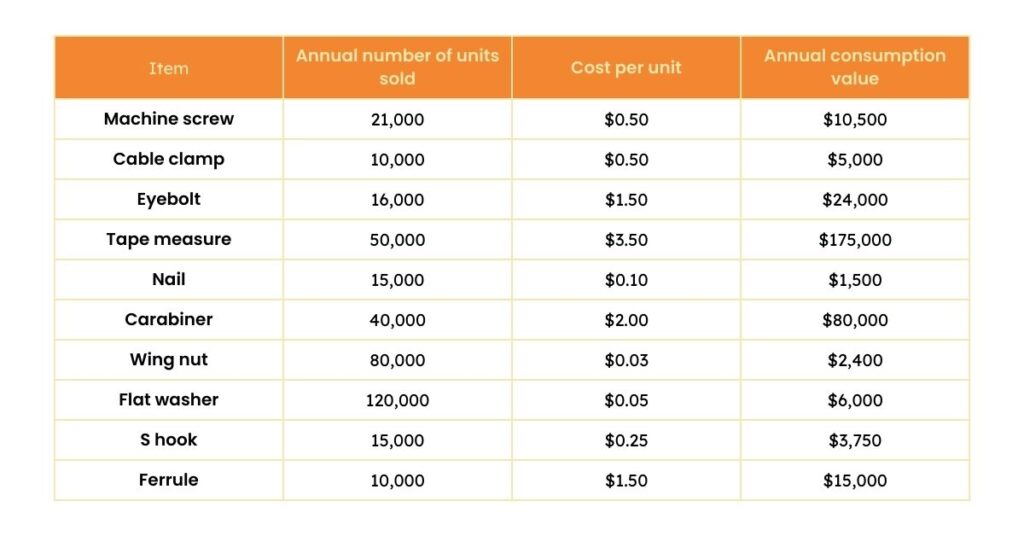
We’re going to use Sam’s Fasteners business for the example:
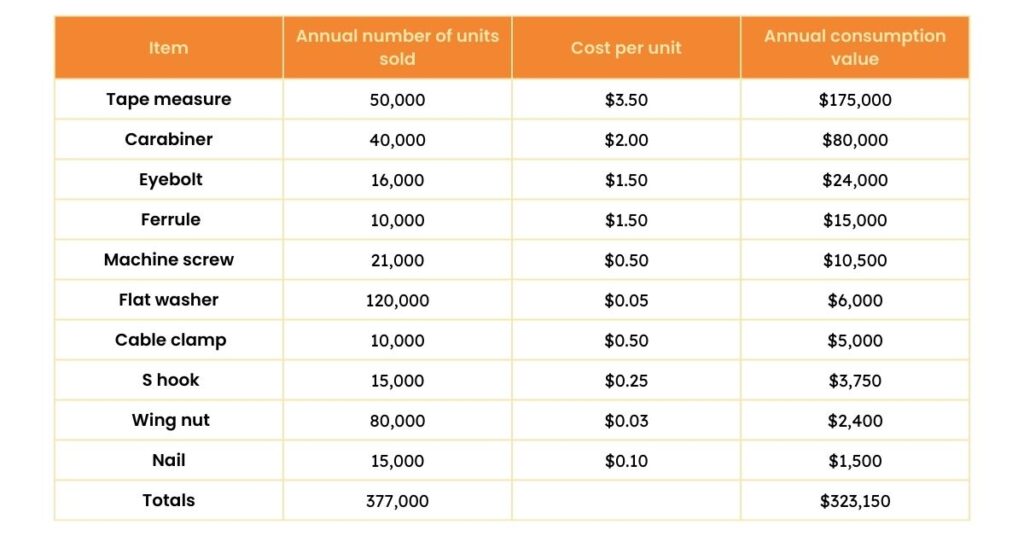
1. Use the formula ‘annual number of units sold × cost per unit’ to calculate the annual consumption value of each item
Annual number of units sold (per item) × cost per unit
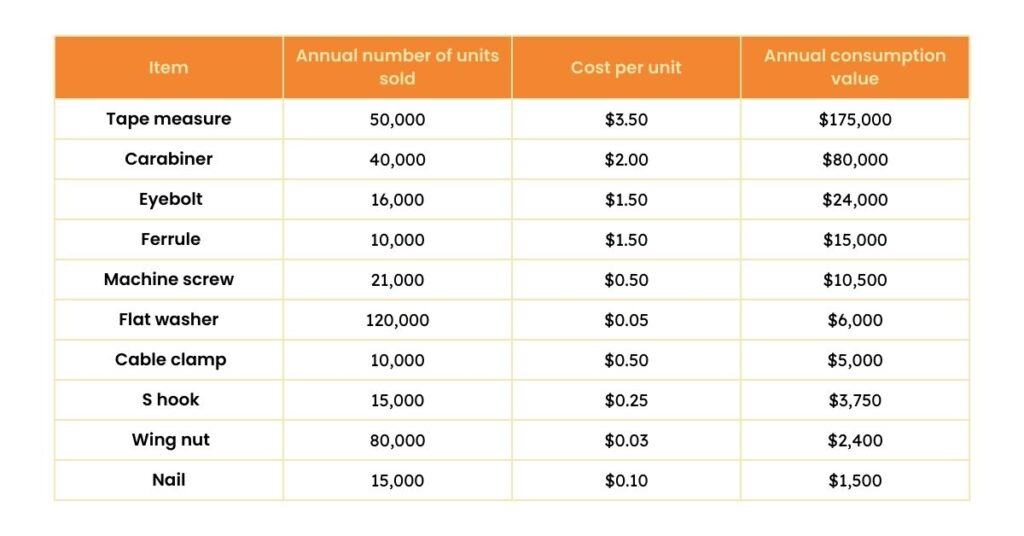
2. List the products in descending order based on their annual consumption value.
3. Total up the number of units sold and the annual consumption value.
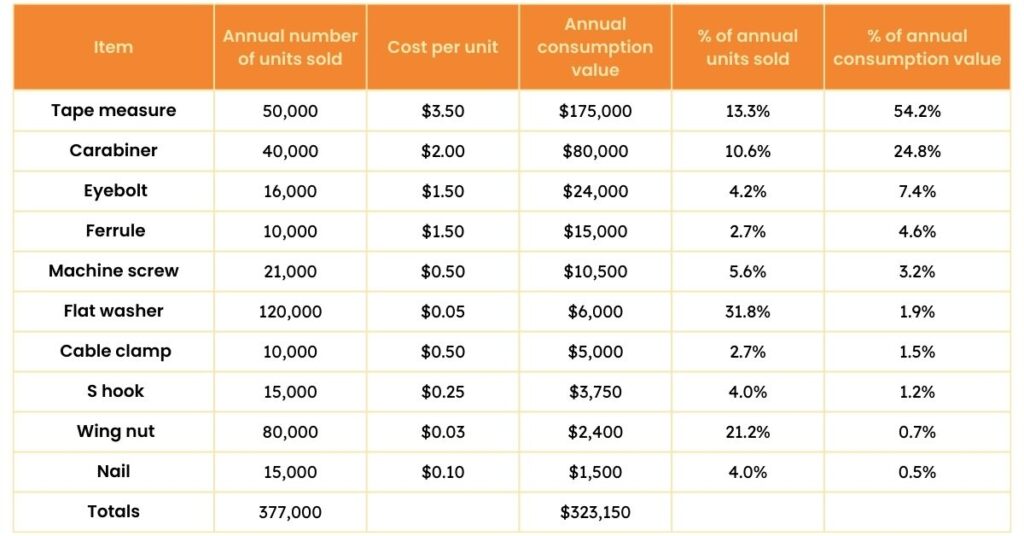
4. Calculate the cumulative percentage of items sold and cumulative percentage of the annual consumption values.
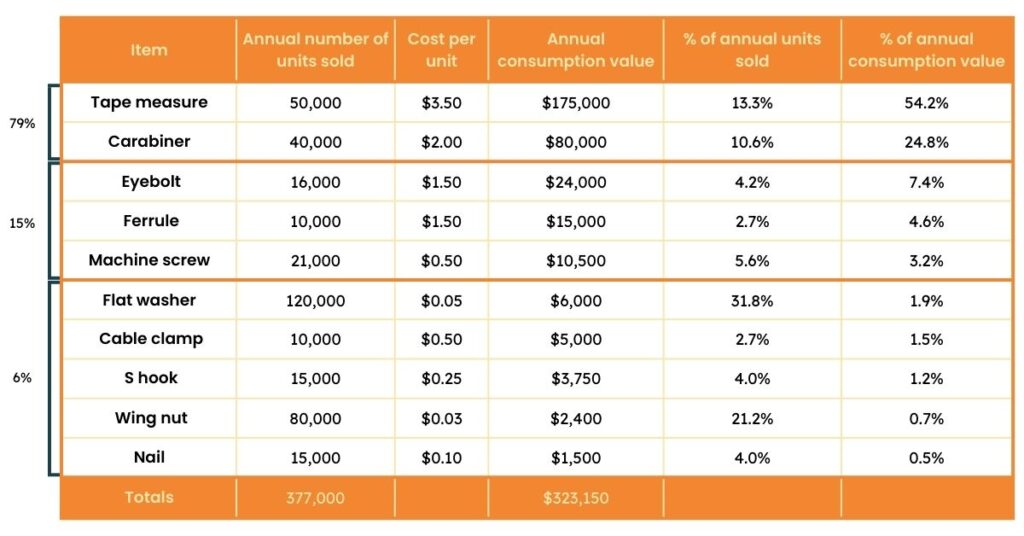
5. Determine the thresholds for splitting the data into A, B and C categories. The threshold for determining the ABC split will be unique to your company and your product mix, but typically it’s close to 80% / 15% / 5%.
Using ABC classification data
With the calculations complete, you can use your final data to review how you currently manage the inventory in each category. If you find that you’re treating all items the same in terms of the stock you hold and the purchases you make – regardless of their category – then you most likely have inefficient inventory policies. This means you’re probably over- and under-ordering on many product lines.
The good news is that there’s plenty of room for improvement, which will reduce storage, delivery and management costs.
Adapting your purchasing and inventory policies for each group is good practice, such as setting up sophisticated ordering processes for all A items. For example, checking every purchase order and spending more time discussing lead times with suppliers to guarantee the best value and timely deliveries.
In contrast, C items should take up much less of your time and could be ordered automatically to save valuable human resources.
Struggling with manual ABC classification?
Discover how EazyStock’s AI platform can automate & optimize your inventory management process.
From ABC classification calculations in Excel to automation systems
ABC classification is a simple framework that allows you to prioritize what stock to focus on and how to manage your time. However, the model does have its drawbacks.
For starters, it’s one-dimensional, so it can only use one factor to evaluate and categorize products. ABC XYZ analysis is a more advanced classification framework you can still use in Excel. This introduces the concept of forecastability, e.g. how easy it is to forecast an item’s demand based on its demand variability. ABC XYZ analysis allows you to segment items based on their value and forecastability, improving your stocking policies and inventory management processes.
X items: regular demand
Y items: strong variability in demand
Z items: very irregular and difficult to predict demand
Adding another level of insights to your inventory classification model allows you to make more informed ordering and stocking decisions. For example, it makes sense to treat AX items (that are valuable and have a constant demand) differently than AZ items (with erratic demand). If demand is steady and easy to predict (X items), your safety stock levels can be much lower than products where demand is much more volatile (Z items).
ABC classification and XYZ analysis still have an obvious limitation; they are manual processes, so they take up valuable time. Despite some enterprise resource planning (ERP) systems or inventory management software solutions providing basic ABC classification of inventory functionality, inventory planners often use Excel spreadsheets instead. Unfortunately, as soon as you can complete your spreadsheet, it will be out dated. Products can rapidly move between categories as their sales/consumption rises and falls. Updating calculations quarterly or even monthly can be very time-consuming.
The answer is to use an inventory optimization tool like EazyStock to automate the ABC analysis of inventory process. EazyStock allows you to categorize your inventory based on multidimensional criteria, including demand, sales frequency, number of picks, and annual consumption value.
Automating your ABC analysis of inventory classification process ensures it stays up-to-date. Daily re-classifications mean products are always managed according to the most relevant inventory policy.
For more information on how EazyStock can help with ABC classification, book a demo below or get in touch with our team.
FAQs about how to calculate ABC analysis
There are five steps to calculating ABC classification or ABC analysis.
- Calculate the annual consumption value of each item using the calculation: annual number of units sold (per item) x cost per unit
- List your products in descending order based on this annual consumption value
- Add up the total number of units sold and the annual consumption value for each item
- Calculate the cumulative percentage of items sold and the cumulative percentage of the annual consumption values
- Set your thresholds for A, B and C categories. The threshold will be unique to your company and product mix, but is usually around 80%/15%/5%
ABC inventory classification is based on the theory that all inventory shouldn’t be treated the same, as each item has a different value to the business. It follows the Pareto Principle, also known as the 80/20 rule.
The Pareto Principle states that 20% of stock accounts for 80% of the business. Therefore, it’s important to ensure that companies prioritise the most valuable items to the business.
ABC analysis prevents all items from being treated the same way in inventory management. Categorising them according to their importance to the business allows inventory management teams to focus on the most important items to ensure stock availability.
Companies use ABC classification to optimise stock by prioritising items based on value and turnover. This allows them to focus on high-value ‘A’ items and reduce the effort on lower-value ‘C’ items.
‘A’ items require tighter control to ensure availability, as they are more important to the business. ‘C’ items usually have low demand, so companies can use a lighter inventory management touch.
There are different software tools for implementing ABC classification in warehouses, depending on the company’s size and inventory value. You can do ABC analysis in spreadsheets, but this is time-consuming and difficult to update.
Some enterprise resource planning (ERP) systems or warehouse management systems (WMS) have basic ABC functionality, but the best tools are specialised inventory optimisation tools, such as EazyStock.
This automates the ABC analysis process with multi-dimensional criteria and reclassifies daily. EazyStock also brings XYZ into the analysis, adding extra criteria to cover demand, sales frequency and number of picks.
You can perform ABC analysis without historical data, using alternative data values. Instead of using historical sales volume and revenue, you can use forecasted demand, expected unit costs or projected inventory turnover.
Yes, you can get a free demo of EazyStock to understand how it does ABC classification. You can also try EazyStock’s free EazyABC tool. Fill in the book a demo form or call our team to arrange a suitable time.