Reorder point planning – how to calculate reorder points
What is reorder point planning?
Reordering point planning involves calculating when stock levels hit a point at which it’s the right time to reorder. This often involves taking into account demand forecasts, current stock levels and lead times, but there are simpler options.
The importance of reorder point planning
It’s important to get reorder point planning right; if you order too soon, you’ll have excess items that will cost money to store – order too late and you’ll risk going out of stock and losing sales.
A few years ago it might have been okay for customers to wait a few days for their goods to come back into stock, but in today’s competitive marketplace, it’s important to deliver quickly, otherwise you risk losing business to competitors.
In a perfect world, all reorder points and reorder quantities would be directly tied to real-time customer demand e.g. when a customer requests an item, you would reorder it and it would arrive instantly (with no lead time).
Unfortunately, in reality, this rarely happens, leading to a number of reordering problems. For many businesses, customer demand and supplier lead times continuously fluctuate. This makes it an ongoing challenge to know how much and how often to reorder.
In this blog post we’ll look at a number of ways to calculate your reorder points and quantities for optimal inventory planning practices.
How to calculate reorder points
There are three common ways to calculate reorder points:
- Fixed reorder point planning
- Min/max reorder point planning
- Periodic reorder point planning
Let’s look at some examples:
1. Fixed reorder point planning
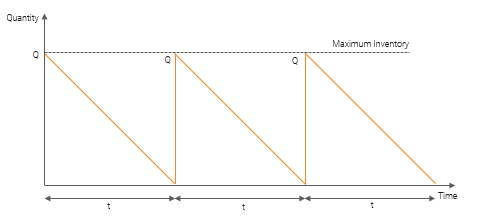
This is the simplest model where both the order period and the order quantity are fixed e.g. you order 200 items every 3 weeks. This model might work in a perfect world where demand is constant and the cost of replenishment is low. In reality, however, demand often follows trends over time and many products are also subject to seasonal fluctuations.
In addition, the cost of sale of each item in your warehouse will most probably vary dramatically, with some items being cheap to sell and others absorbing much more investment. Ordering the same amount of every item at regular intervals does therefore not make financial sense. It could also lead to inventory turnover issues, as investment is tied up in excess stock, while other items end up out of stock, at the risk of upsetting important customers.
2. Min/max reorder point planning
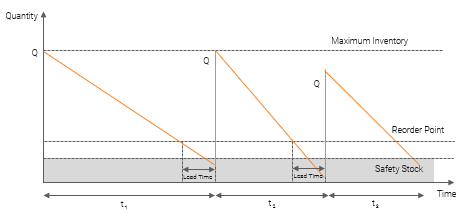
Using this model, stock levels are tracked and reordering is triggered when inventory drops to the reorder point, regardless of frequency. The reorder point is the threshold which defines when an order needs to be placed and the time between each order varies depending on demand. The reorder quantity is a fixed amount (the difference between the min and max value). For example, you order 200 items with a six week gap, then 200 items with a three week gap, etc.
This reorder point model can be used when demand is highly variable over time.
The reorder point is specified in such a way that demand can be met from the existing inventory during the delivery lead time or through safety stock.
3. Periodic reorder point planning
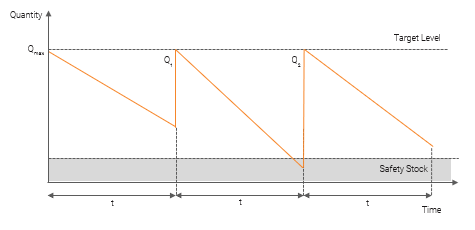
With this reorder point method you place orders when you reach a specific date in a fixed order cycle. The variable order quantity is calculated so that stock is replenished back up to the target stock level e.g. you order every two weeks and the amount you order varies every time so stock levels stay the same.
Again, this model is only effective if demand is fairly constant. If demand varies too much, it requires very high safety stock levels which can cause large carrying costs and result in diminished profit margins.
As you can see, there are advantages and disadvantages to all three reorder point calculations. Therefore, it’s not uncommon for businesses with complex product offerings to use a variety of models, depending on their needs at the time. However, this can create a big headache for buyers and increase the margin for error when reordering.
Dynamic reorder point calculations
So, what’s the optimal way to calculate reorder points for effective replenishment planning?
Ideally you want to set your reorder points so that you always receive new deliveries just when you hit your safety stock level. You also want the reorder quantity to reflect demand, stock on hand and stock on order – see the graph below. In this example both the order frequency and order quantities are constantly changing to reflect demand and lead times.
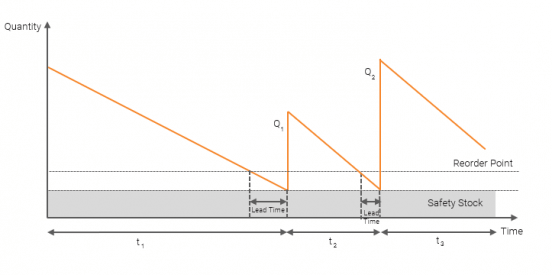
How to calculate the reorder point – an example:
The reorder point formula ensures you have enough stock to cover your demand during your lead time and adds your safety stock to this number.

Safety stock is an important element of any reorder point formula. No matter how good your forecasts are, there will always be a risk of unexpected highs or lows in your demand or late deliveries (extended lead times). To compensate for this, you need a layer of safety stock, e.g. extra stock you can use in unforeseen circumstances.
To use dynamic reorder points, you need to keep track of suppliers’ lead times, especially if reliability is an issue. You also need to understand how your products’ demand fluctuates. Both will influence your reorder point calculations’ outcome.
However, this is still a relatively simple model. To make it more dynamic, you may also want to consider:
- How are your inventory costs (deliveries, warehousing, etc.) affected by order frequency?
- What service level targets do you want to set e.g. with how much certainty do you want to be able to ensure order fulfillment?
- Do you need to consider supplier restrictions, such as min/max order quantities?
- How many orders can your internal operations team physically place and accept as deliveries?
Automating reorder point planning calculations
Obviously, managing such a wide range of variables can be an extremely complex job, and the more SKUs you carry, the more difficult the task!
Unfortunately, many stock ordering systems only offer basic functionality to support. Most allow you to enter a reorder level and a reorder quantity manually and then alert you when an order needs placing. This means that all your replenishment calculations need to be done manually using complicated and time-consuming spreadsheets.
That’s why more and more inventory managers are investing in inventory optimization software. Tools like EazyStock can be plugged into a stock ordering system so they take a daily feed of stock levels and sales data and then automatically work out what items you need to order and in what quantity.
EazyStock takes into account all of the demand and supply variables we have discussed in this post and provides a daily list of recommended orders. These orders can be automatically passed back to your stock system to raise purchase orders, or can be sense-checked by your team prior to approval.
Click on these links to read more about EazyStock’s features that support statistical demand forecasting, dynamic inventory policies, automated replenishment and smart supplier lead time management.
Benefits of effective reorder point planning
If you succeed in optimizing your reordering processes, there is much to gain.
For starters, your finance team will be pleased to see your overall inventory turnover improve and inventory levels drop, releasing working capital to be used elsewhere in the business.
Secondly, your sales team will be happier knowing you can guarantee higher levels of stock availability. Finally, your supply chain will be more agile, as you’ll always have the inventory you need in the right place at the right time.
Want to know more about how EazyStock can help you with your replenishment processes? Book a demo with one of our experts.
Originally published 16 June 2016, updated November 2021.
