8 best inventory demand forecasting techniques

Demand forecasting techniques
Demand forecasting techniques play a critical role in inventory management. If you can accurately forecast market demand, you can take action to ensure you hold the correct stock to maximize sales and profit. However, producing an accurate inventory demand forecast is no mean feat. In this post we uncover eight top demand forecasting techniques and best practice tips that you can’t be without.
But first – let’s get a definition:
What is inventory demand forecasting?
Inventory demand forecasting is the process of predicting customer demand for an inventory item over a defined period of time. Accurate inventory demand forecasting enables a company to hold the right amount of stock, without over or under-stocking, for optimum inventory control. Historical data trends and market knowledge of how demand can fluctuate are often used to forecast inventory demand.
The importance of accurate inventory forecasting
Forecasting inventory can be as basic or as complex as you make it. As a simple rule, the more sophisticated your inventory forecasting techniques, the more accurate your predictions will be. Accurate demand forecasts allow you to efficiently serve customers’ needs without investing capital in large amounts in stock, effectively helping you lower your overall operational costs. However, inventory forecasting can be challenging to undertake without the right guidance, so starting with basic forecasting techniques is advisable.
8 of the best demand forecasting techniques
There are many demand forecasting techniques a business can implement which can use both quantitative forecasting and (using historical demand data) and qualitative forecasting (based on more subjective opinions and insights) methods.
Here are our eight top demand forecasting techniques:
- Use demand types
- Identify trends
- Adjust forecasts for seasonality
- Include qualitative inputs
- Remove ‘real’ demand outliers
- Account for forecasting accuracy
- Understand your demand forecasting periods
- Consider demand forecasting software
Let’s take a closer look at each in more detail:
1. Inventory forecasting: demand types
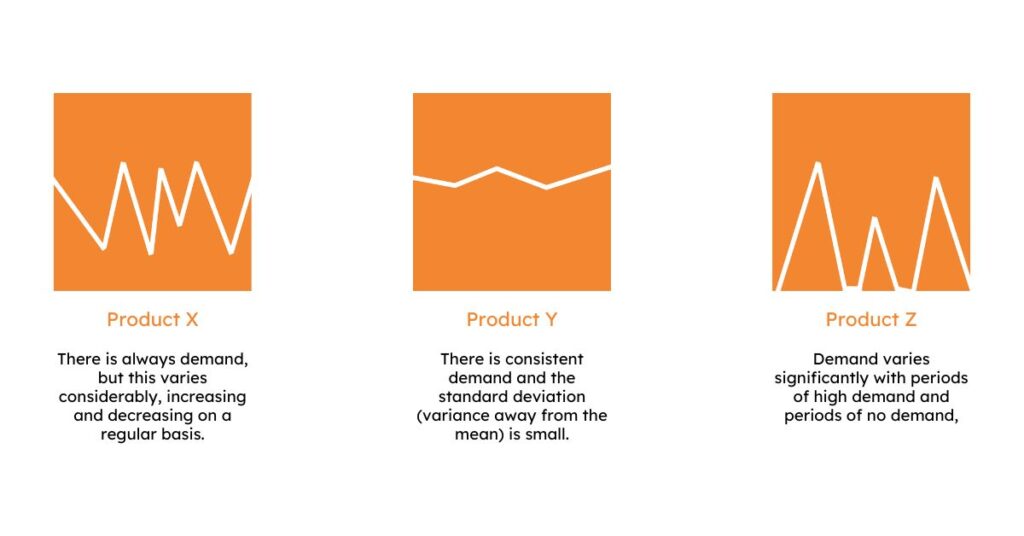
If you analyzed the historical sales data of every product in your warehouse, you’d find that the demand for different items varies considerably. Some will have consistently high demand over time, for others there could be sporadic or low demand.
For example:
In addition, as products move through their product lifecycle from market entry to maturity and decline, their demand types will keep changing:
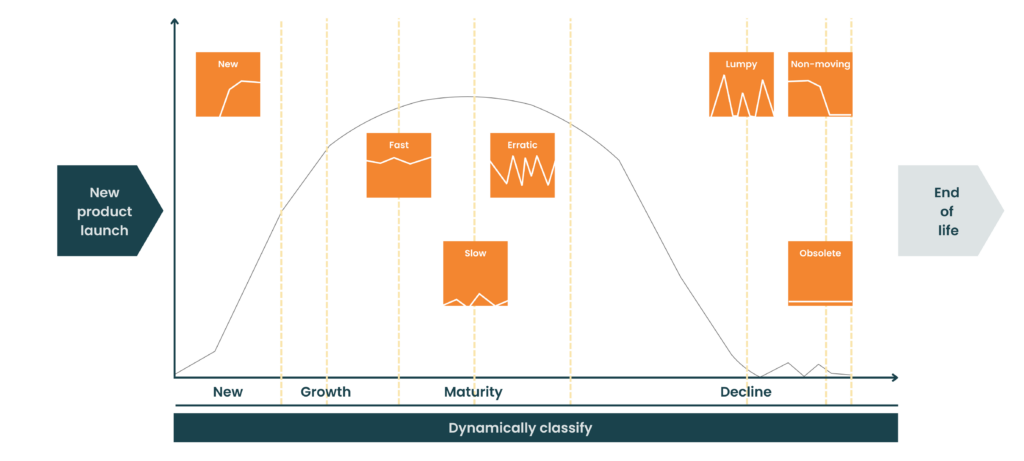
An item’s demand type is important, as it should be used to determine the type of calculation (or algorithm) you use for forecasting. It makes statistical sense to use a different equation to calculate the demand of a product with an erratic demand type, to one with slow demand.
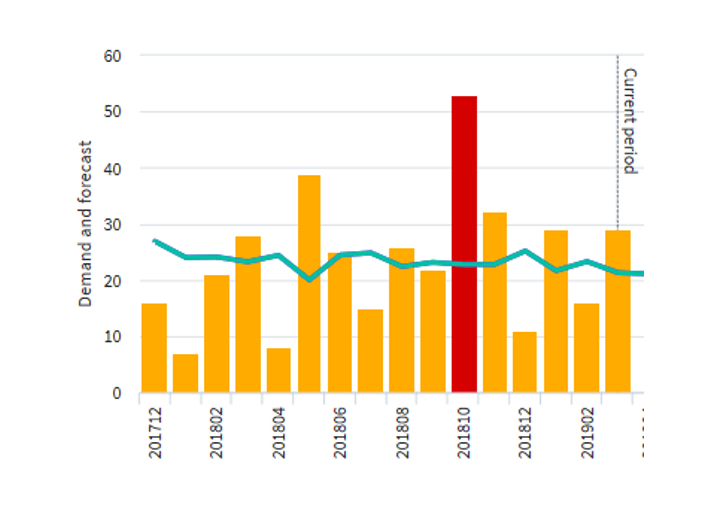
Calculating your base demand is just the start of producing accurate demand forecasts. Below is an example of the different demand factors that can impact or inflate your normal base demand.
2. Inventory demand trends
The demand for your inventory items will ebb and flow as fashions change, new technologies replace old and social, economic and legal factors influence demand.
Items will also follow demand trends as they move through the product cycle. For example, in the growth phase, the trend in demand will be upwards, while in the decline phase, the trend will reverse.
Make sure you look out for trends in your historical demand data and adjust your inventory forecasts accordingly. There’s no point creating a forecast based solely on your base demand if items are following a specific trend.
3. Forecasting demand for seasonal items
Almost every manufacturer, distributor or retailer can expect to see seasonal demand fluctuations for some of their product lines. Seasonal weather patterns, school holidays and annual traditions all have a seasonal influence on demand.
Understanding how these seasonal factors affect your customers’ purchasing habits will help you take advantage of peaks in demand and plan for the troughs.
Best practice is to keep seasonal demand factors separate from your base demand calculations. This keeps the data clean and easier to use for forecasting going forward.
4. Qualitative inputs
While historical data (quantitative demand forecasting) provides a great basis for achieving demand forecasting accuracy, sometimes you’ll also need to consider more qualitative factors. Qualitative demand forecasting includes accounting for future events and external market factors, such as sales promotions and competitor activity.
Make sure you input any sales and marketing insights you have into your forecasts to make them as accurate as possible.
5. Inventory demand forecasting outliers
Unusual demand outliers can be the result of known actions (sales promotions, large one-time orders, employee strikes, etc.) or unpredictable events (a competitor going out of business, natural disasters, etc.).
Take the time to analyze your inventory forecasting data to detect outliers, as they can significantly skew the accuracy of your forecasts. Any demand data – high or low – outside of the reasonable standard deviation of average demand needs to be identified. You then need to make a judgement call on whether it should be included in your demand forecasting calculations (if it’s part of a trend) or not (if it’s an anomaly in demand).
6. Understand demand forecasting accuracy
Your demand forecasts are very unlikely to be 100% accurate. So, if you can calculate the level of error in your previous demand forecasts, you can factor this into future forecasts. If you can determine how uncertain a forecast is for a given business period you can make the necessary adjustments to your inventory management rules, such as increasing safety stock levels to cover uncertain periods of demand.
There are many formulas to help you measure demand forecast accuracy, or forecast error. The Mean Absolute Percent Error (MAPE) will calculate the mean percentage difference between your actual and forecasted demand over a given period, while the Mean Absolute Deviation (MAD) shows the deviation of forecasted demand from actual demand in units.
7. Demand forecasting periods and reviews
The time period you choose for your demand forecasting has a direct impact on the accuracy of your forecast. For example, a forecast looking at your inventory’s demand over the next two weeks is much more likely to be accurate than a forecast that looks 12 months out.
In addition, if markets are volatile, or an item’s demand pattern is erratic, you’ll need to review your forecasts on a much more regular basis than in slow markets or for slow moving products. If you begin to experience stock outs or see cases of excess stock, then you may need to adjust your forecasting intervals.
8. Consider demand forecasting software
Accurate demand forecasting is not a simple task, especially if you want to track each SKU and you have a large product portfolio. Inventory forecasting also requires an accurate picture of the stock levels in your warehouse and your sales across each channel.
Inventory optimization software offers a fast and accurate means of forecasting, no matter how complex or varying the demand. While enterprise resource planning systems (ERP), warehouse management systems (WMS) and eCommerce platforms can offer a certain level of forecasting, investing in inventory optimization software supports more complex demand forecasting requirements.
Statistical demand forecasting systems, such as EazyStock, will ensure you have a tool to swiftly and accurately complete your complex demand forecasting requirements in order to reduce stock outs, decrease tied-up capital and, most importantly, meet customer requirements.
If you’d like to improve how you forecast demand and find out more about EazyStock’s inventory forecasting capabilities, please contact us or call us at +1 (844) 416-5000.
FAQs about best inventory demand forecasting techniques
The main demand forecasting techniques are qualitative forecasting, quantitative forecasting, and time-series forecasting.
Quantitative forecasting is statistically driven. With quantitative forecasting, you’ll use historical demand data, or sales data, and combine it with a mathematical formula to determine future performance.
Qualitative forecasting is far more subjective and relies on educated deductions rather than number crunching. Demand is forecasted based on expert knowledge and experience of how the market works. This could come from a single key person or from opinions and insights, both internal and external to the business.
Time-series forecasting uses historical data to predict future demand by seeing changes over time. More data over a longer period makes it easier to see patterns that you can extend to project future needs. This helps to identify seasonal peaks, changes in product lifecycles, recurring patterns, and outliers.
The most accurate forecasts use a combination of the two methods. There are eight key demand forecasting steps:
- Use demand types
- Identify trends
- Adjust forecasts for seasonality
- Include qualitative inputs
- Remove ‘real’ demand outliers
- Account for forecast accuracy
- Understand demand forecasting periods
- Use demand forecasting software
Quantitative forecasting is statistically driven. With quantitative forecasting, you’ll use historical demand data, or sales data, and combine it with a mathematical formula to determine future performance.
Qualitative forecasting is far more subjective and relies on educated deductions rather than number crunching. Demand is forecasted based on expert knowledge and experience of how the market works. This could come from a single key person or from opinions and insights, both internal and external to the business.
The right forecasting technique depends on the product’s stage in its lifecycle, data availability, market volatility, and product behavior. The best forecasting techniques combine qualitative and quantitative methods.
For new products or those with demand uncertainty, use the Delphi method, market research, and scenario planning. See if you have similar products with comparable demand.
- For items with stable demand or for short-term forecasts, you could use comparable sales periods, moving average or exponential smoothing.
- For items with complex demand or large datasets, use specialist demand forecasting software with advanced algorithms.
Exponential smoothing is a time-series forecasting method that predicts future values by creating a weighted average of past data. These observations are exponentially weighted to decrease over time to forecast the upcoming period.
It is more advanced than standard time-series analysis and moving-average forecasting, as it places greater weight on recent data, making it more responsive to changes in demand. As it doesn’t require much data to start, it is best suited for short- or medium-term forecasting.
Trends projection helps in long-term inventory planning by analyzing sales data, market trends, and customer behavior. Demand will vary due to fashion changes, new technologies, and the influence of social, economic, and legal factors.
Identifying trends in historical demand data allows you to adjust your forecasts accordingly.
Stable sales patterns have minimal volatility and don’t usually follow trends or seasonality, which makes the moving average technique a reliable, simple tool for accurate forecasting.
As items with stable demand experience minor fluctuations and little ‘noise’, averaging data over a specific period prevents unnecessary reactive inventory management.
As you can calculate moving averages in Excel, it provides an easy and accessible way to forecast demand. The period you are measuring can be easily adjusted, and forecast periods can be longer than for unstable items.
As a moving average is a simple calculation and easy to understand, it provides a reliable baseline to compare other forecasting methods. It’s essential to monitor actual demand to spot any changes that mean the moving average technique will no longer be suitable.
Seasonal demand forecasting techniques help balance inventory levels throughout the year, rather than assuming spikes are permanent trends in demand. This allows additional stock to be purchased for peak periods, but adjusts order levels down once the peak has passed.
This ensures you have sufficient stock to capitalize on increases in product demand at peak times of the year and to keep products in stock. It also prevents having excess stock at the end of a season, with the dilemma of selling it off at a discounted rate or taking on the burden of inflated carrying costs until demand picks up again.
The Delphi approach or Delphi method is a structured qualitative forecasting technique that involves sending a questionnaire to relevant experts, such as customers and suppliers.
The results are analyzed and returned anonymously to the participants, who can reconsider their original responses in light of other views and opinions until a final consensus is found. This more formal approach helps reduce the influence of face-to-face meetings, but it could still introduce inherent bias from the experts chosen.
The Delphi method is generally used for long-term, complex, or new items that have little or unreliable data. As the experts involved are anonymous, it provides balanced arguments where all participants have equal weight.
This method also allows participants to review and refine their opinions throughout the process based on the opinions of other participants, providing more thoughtful and considered results.